
1 材料与方法
1.1 细胞系
1.2 药物及主要试剂
1.3 主要仪器
1.4 细胞培养
1.5 受试物处理
1.6 细胞存活率检测
1.7 肝功能生化指标检测
1.8 Western blot检测胆汁酸转运体蛋白表达量
1.9 MDA含量和SOD活性检测
1.10 统计学分析
2 结果
2.1 联合用药对HepG2细胞存活率的影响
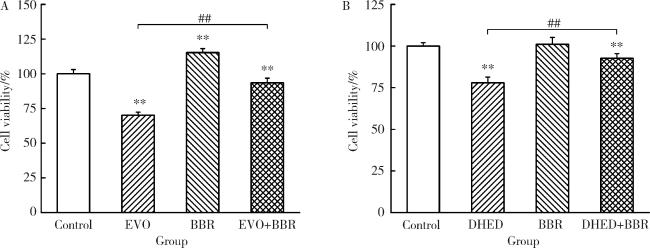
图1 EVO、DHED和小檗碱处理48 h对HepG2细胞存活率的影响($\bar x \pm s$, n=3)Figure 1 Effects of EVO, DHED and BBR treatment for 48 h on the cell viability of HepG2 cells ($\bar x \pm s$, n=3) A, the cells were treated with EVO 1 μmol/L, BBR 10 μmol/L, or EVO 1 μmol/L+BBR 10 μmol/L; B, the cells were treated with DHED 50 μmol/L, BBR 35 μmol/L, or DHED 50 μmol/L+BBR 35 μmol/L for 48 h, respectively. **P < 0.01, compared with the control group; ##P < 0.01, compared with the EVO or DHED group. EVO, evodiamine; BBR, berberine; DHED, dehydroevodiamine. |
2.2 联合用药对肝功能生化指标的影响
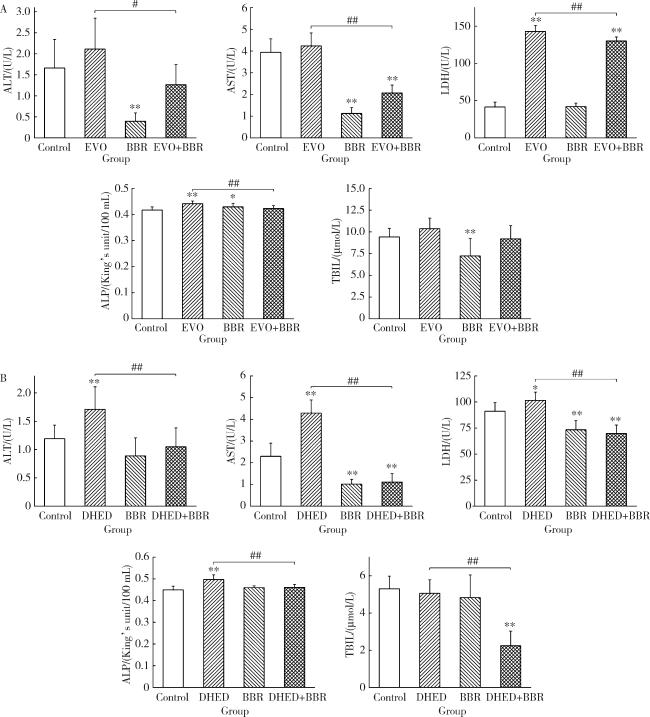
图2 EVO、DHED和小檗碱处理48 h对HepG2细胞肝功能指标的影响($\bar x \pm s$, n=3)Figure 2 Effects of EVO, DHED and BBR treatment for 48 h on the liver function indicators of HepG2 cells ($\bar x \pm s$, n=3) Group A and group B are the same as Figure 1. * P < 0.05, ** P < 0.01, compared with the control group; # P < 0.05, ## P < 0.01, compared with the EVO or DHED group. EVO, evodiamine; BBR, berberine; DHED, dehydroevodiamine; ALT, alanine transaminase; AST, aspartate amino-transferase; LDH, lactate dehydrogenase; ALP, alkaline phosphatase; TBIL, total bilirubin. |
2.3 联合用药对胆汁转运体蛋白表达的影响
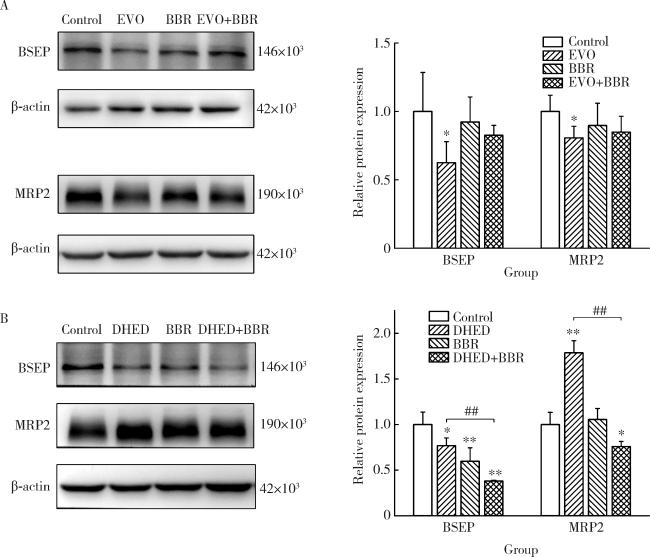
图3 EVO、DHED和小檗碱处理48 h对HepG2细胞BSEP和MRP2蛋白表达的影响($\bar x \pm s$, n=3)Figure 3 Effects of EVO, DHED and BBR treatment for 48 h on the expression levels of BSEP and MRP2 of HepG2 cells ($\bar x \pm s$, n=3) The protein expression levels were detected by Western blot, and the semi-quantitative analysis was performed. Group A and group B are the same as Figure 1. * P < 0.05, ** P < 0.01, compared with the control group; ## P < 0.01, compared with the EVO or DHED group. EVO, evodiamine; BBR, berberine; DHED, dehydroevodiamine; BSEP, bile salt export pump; MRP2, multidrug resistance-associated protein 2. |
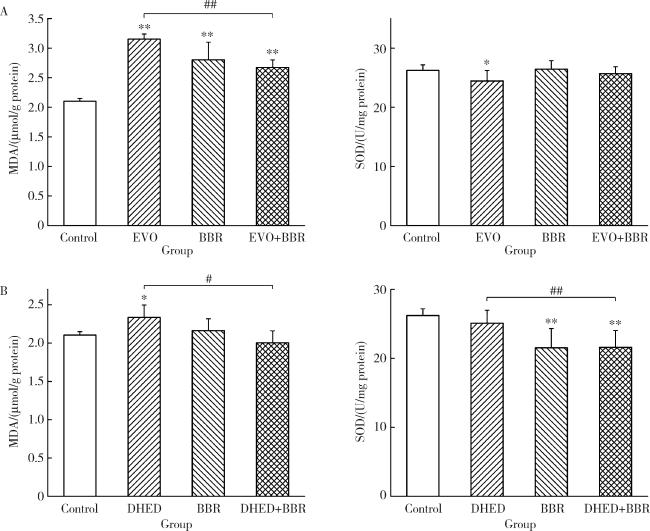
2.4 联合用药对MDA含量和SOD活性的影响
图4 EVO、DHED和小檗碱处理48 h对HepG2细胞MDA含量和SOD活性的影响($\bar x \pm s$, n=3)Figure 4 Effects of EVO, DHED and BBR treatment for 48 h on MDA content and SOD activity of HepG2 cells ($\bar x \pm s$, n=3) Group A and group B are the same as Figure 1. * P < 0.05, ** P < 0.01, compared with the control group; # P < 0.05, ## P < 0.01, compared with the EVO or DHED group. EVO, evodiamine; BBR, berberine; DHED, dehydroevodiamine; MDA, malondialdehyde; SOD, superoxide dismutase. |