
不同软件平台分析肠易激综合征患者肠道菌群结构的比较
[朱诗玮1 , 刘作静1 , 李默2 , 朱怀球2, △  , 段丽萍
, 段丽萍1, △ ]
, 段丽萍]
|
|


肠道菌群紊乱是肠易激综合征(irritable bowel syndrome, IBS)的发病原因之一, 《罗马Ⅳ :功能性胃肠病》提出菌-肠-脑轴功能紊乱可以影响IBS患者内脏敏感性、肠黏膜炎症及肠黏膜通透性等[1]。目前, 细菌16S核糖体RNA(16S rRNA)测序是研究肠道菌群的主要方法[2]。细菌16S rRNA大小适中, 具有极好的保守性, 可以用于鉴别不同物种[3]。通过扩增细菌16S rRNA的目的片段, 对所得产物进行高通量测序, 测序数据通过计算平台进行拼接、质量控制、过滤等分析, 逻辑聚类形成不同操作分类单元(operational taxonomic units, OTUs)后与已知数据库进行比对, 最终得到菌群结构及丰度等相关数据, 可用于组间和/或组内的肠道菌群的分析比较[4]。文献回顾[5, 6, 7, 8]发现, 不同研究对于IBS患者肠道菌群结构紊乱特征的描述存在差异, 对于IBS患者的肠道菌群结构紊乱特征, 不同的研究所获得的结果也不相同, 且不同研究所得出的与IBS发病相关的特异菌也存在明显不同, 这种差异除了与客观外在因素(如人种、饮食、疾病的诊断标准等)有关以外, 还可能与菌群数据分析的方法相关, 如所选16S rRNA片段不同, 对16S rRNA目的片段扩增手段不同, 高通量测序数据及分析平台选择的差异等。本研究使用目前较常用的Uparse(V2.0)和 Mothur(V1.39.5)两个高通量测序数据分析平台, 分别对同一批粪便菌群样本测序结果进行分析, 比较不同平台分析所得肠道菌群结构是否存在差异, 及不同平台分析结果对疾病鉴别及疗效评价的影响。
从2015年3月至2016年4月就诊于北京大学第三医院消化科门诊, 符合《罗马Ⅲ :功能性胃肠病》诊断标准且给予药物治疗的腹泻型IBS患者中随机抽取9位, 留取患者治疗前(IBS组)及治疗后(IBS-treatment, IBSt组)各9例粪便样本; 从同期招募的无症状健康志愿者中抽取9位作为健康对照组(healthy control, HC组), 留取粪便样本。所有受试者均完成临床问卷调查且符合纳入与排除标准[9], IBS患者治疗方法为利福昔明0.4 g, 2次/d, 疗程28 d。本研究通过北京大学医学部生物医学伦理委员会审查(伦理批号:IRB00001052-14091), 所有受试者均签署知情同意书。
参照人类微生物组计划推荐的方法留取粪便及提取粪便DNA。本研究所选用于扩增、测序的 16S rRNA基因片段区域为V3~V4可变区, 引物采用338F~806R, 测序平台为Illumina MiSeq高通量测序平台, 测序结果序列条数大于1 000条的样本为合格样本, 由美吉生物有限公司提供测序结果保证。
1.2.1 基本资料收集和问卷调查 采集受试者的基本临床资料, 包括性别、年龄、身高、体重和排便状况, 完成胃肠道症状评定量表(gastrointestinal symptom rating scale, GSRS)和Bristol粪便性状量表。
1.2.2 高通量测序结果分析及物种预测分析 分别应用Uparse平台及Mothur平台对原始测序数据进行优化和OTUs计算。Uparse平台数据去杂方法和参数:(1)设置50 bp的窗口, 当窗口中碱基的平均质量值低于20 bp时, 将该部分序列剪切掉, 去除含不确定碱基(N碱基)的序列; (2)根据序列之间的重叠序列关系拼接, 最小重叠长度为10 bp; 拼接序列的重叠区允许的最大错配比率为 0.2, 筛除不符合要求的序列; (3)根据序列首尾两端的标记和引物区分样品, 标记允许的错配数为0, 最大引物错配数为2; (4)按照97%相似性进行OTUs聚类, 在聚类过程中去除嵌合体和单序列, 并得到OTUs的代表序列; (5)将OTUs代表序列比对数据库进行分类学分析, 置信度阈值为0.7, 比对数据库为Silva (V128)。Mothur平台数据去杂方法和参数:(1)根据PE 序列之间的重叠关系, 将成对序列拼接成一条序列拼接序列, 删除含N碱基的序列以及长度大于470 bp的序列, 删除重复序列; (2)对齐序列, maxhomop=8, 过滤并且进行预先聚类, 每100 bp的序列允许1个差异; (3)调用VSEARCH算法来分类并且检查嵌合的数据, 以序列丰度作为参考, 如果一个样本中某个序列被标记(dereplicate=F)则将其删除, 以相似度97%聚类得到OTUs的代表序列; (4)将OUTs代表序列比对数据库进行分类学分析, 置信度阈值为 0.8, 比对数据库为Silva (V128)。
1.2.3 微生物α 多样性分析 利用Mothur平台计算不同样本中的Shannon指数, 反映各样本在不同测序数量时的微生物α 多样性(microbial α diversity)。
1.2.4 物种组成分析 使用较直观的饼图、柱状图或韦恩图等分析样本中含有何种微生物和各微生物的相对丰度。
1.2.5 样本差异性分析 主坐标分析(principal co-ordinates analysis, PCoA)基于所选距离矩阵进行作图用来研究样本群落组成的相似性或差异性。非度量多维尺度分析(nonmetric multidimensional sca-ling, NMDS)是一种将多维空间的研究对象(样本或变量)简化到低维空间进行定位、分析和归类的方法。
1.2.6 物种差异性分析 LEfSe分析(linear discriminant analysis effect size, LEfSe)是一种用于发现高维生物标识和揭示基因组特征的分析方法。根据分类学组成对样本按照不同的分组条件进行 线性判别分析(linear discriminant analysis, LDA), 找出对样本划分产生显著性差异影响的群落或物种。
应用 SPSS 20.0 软件进行统计分析。正态分布且符合方差齐性的计量数据用均数± 标准误表示, 多组组间比较采用单因素方差分析(One-Way ANOVA)。偏态分布或不具有方差齐性的数据用 M (Max, Min)表示, 多组间比较采用非参数Mann-Whitney U 检验。率以百分数表示, P< 0.05 为差异有统计学意义。
本研究共纳入HC组9例[女性1例, 平均年龄(29.67± 1.64)岁, BMI(23.54± 1.27) kg/m2], IBS组9例[女性1例, 平均年龄(34.78± 3.52)岁, BMI(23.57± 1.14) kg/m2], IBSt组9例[女性1例, 平均年龄(34.78± 3.52)岁, BMI(23.57± 1.14) kg/m2], 各组人口学资料差异无统计学意义。临床症状问卷调查结果显示, IBS组Bristol评分, GSRS的腹痛、腹胀、腹泻以及饱腹感的程度显著高于HC组, IBSt组所有症状评分比IBS组有所降低, 但差异无统计学意义(表1)。粪便DNA测序结果显示所有样本的V3~V4区共扩增得到1 498 527条16S rRNA基因序列, 单个样本测序量平均达50 948条, 平均序列长度达到436.78 bp, 测序结果可信。
| 表1 各组临床症状及菌群多样性比较 Table 1 Clinical symptoms and microbial α diversity among three groups |
测序数据分别经Uparse平台和Mothur平台分析, 所得初始数据分别进行OUTs丰度和物种分类的整合与筛选:(1)删除质信度< 80%或未分类的菌; (2)删除在于特殊环境(如深海、冰川等)或者主要存在于土壤、植物中的菌; (3)删除在所有样本中丰度和为0的菌。
2.3.1 微生物α 多样性比较 Uparse平台分析所得菌群Shannon指数中HC组与IBS组比较差异无统计学意义, IBSt组比HC组Shannon指数显著降低; Mothur平台分析所得结果亦然。比较两个平台间各组菌群α 多样性的差异均无统计学意义(表1)。
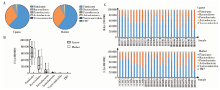
2.3.2 肠道菌群结构变化 在门水平, Mothur平台比Uparse平台更多比对出1个TM7菌门, 其他菌门(Firmicutes, Bacteroidetes, Proteobacteria, Actinobacteria, Verrucomicrobia)差异无统计学意义(图1)。所有样本都表现为以Firmicutes、Bacteroidetes和Proteobateria丰度为主的菌群结构, 这一结论在两个平台中一致。同一平台内, HC组、IBS组和IBSt组在不同菌门水平丰度差异无统计学意义。
 | 图1 Uparse 平台和Mothur平台分析所得总样本肠道菌群门水平结构Figure 1 Microbial composition analysis at phylum level by Uparse and Mothur pipeline A, comparison of microbial composition at phylum level in two pipelines; B, pipeline difference in the relative abundance (RA) of each phylum; C, microbial composition of each sample at phylum level. |
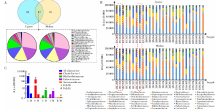
两个平台细菌科水平比较中只有47个菌科是一致的(图2), 对其丰度进行分析发现(图2A), 这47个菌科丰度的和占总样本菌群科水平的98.60%(Mothur平台)和99.06%(Uparse平台), 除了Alcaligenaceae, Clostridiaceae 1, Bdellovibrionaceae, Eubacteriaceae和Aeromonadaceae 5个菌科的丰度在两个平台分析结果中差异有统计学意义, 其他菌科在两个平台中丰度差异均无统计学意义。Alcaligenaceae和Clostridiaceae 1菌科在Uparse平台分析中的丰度显著高于Mothur平台(P < 0.01), 而Bdellovibrionaceae, Eubacteriaceae, Aeromonadaceae 3个菌科在Uparse平台分析中的丰度显著低于Mothur平台(P< 0.05, 图2C)。通过对两个平台分析结果的每一例样本进行菌群科水平构成分析发现, 有的样本菌群科水平构成在两个平台结果中存在较大的差异, 如HC012样本和HC033样品(图2B)。Uparse平台结果中HC012样本Ruminococcaceae丰度占30.60%, HC033样本中Porphyromonadaceae丰度占2.25%, 而Mothur平台结果中HC012样本Ruminococcaceae丰度占14.33%, HC033样本中Porphyromonadaceae丰度占 17.98%。
 | 图2 Uparse 平台和Mothur平台分析所得总样本肠道菌群科水平结构Figure 2 Microbial composition analysis at family level by Uparse and Mothur pipeline A, family count numbers and comparison of microbial composition at family level in two pipelines; B, pipeline difference in the relative abundance (RA) of 5 families; C, microbial composition of each sample at family level.U, Uparse; M, Mothur. |
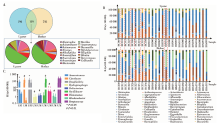
菌属水平比较显示(图3), Uparse平台分析比对得到313个不同菌属, Mothur平台分析比对得到329个不同菌属, 其中119个菌属为两个平台分析结果共有, 对这119个菌属的构成比进行分析发现(图3A), 其丰度仅占总样本菌属水平的54.03%(Uparse平台)和69.56%(Mothur平台)。除了Anaerotruncus, Citrobacter, Desulfovibrio, Hydrogenophaga等菌属的丰度在两个平台结果中差异有统计学意义外, 其他菌属丰度均差异无统计学意义 (图3C)。通过对两个平台分析结果的每一例样本的菌属构成比进行分析发现, 其中16个样本存在较大差异(图3B), 例如Uparse平台结果中HC012样本Subdoligranulum丰度占14.23%, HC033样本中Barnesiella丰度占0.35%, 而Mothur平台结果中HC012样本Subdoligranulum丰度为0, HC033样本中Barnesiella丰度占15.90%。Subdoligranulum属于Ruminococcaceae, Barnesiella属于Porphyromonadaceae, 这两种菌属在两个分析平台的变化与其所在菌科的变化一致。对于样本HC026, 菌属Megamonas, Subdoligranulum, Klebsiella和Dialister在两个平台的丰度分别为4.20%, 2.28%, 1.39%, 2.67%(Uparse平台)和0, 0, 0, 0(Mothur平台); 样本IBS074中, 菌属Roseburia在Uparse平台中丰度为0.06%, 而在Mothur平台中丰度为4.59%。
 | 图3 Uparse 平台和Mothur平台分析所得总样本肠道菌群属水平结构Figure 3 Microbial composition analysis at genus level by Uparse and Mothur pipeline A, genus count numbers and comparison of microbial composition at genus level in two pipelines; B, pipeline difference in the relative abundance (RA) of 9 genus; C, microbial composition of each sample at genus level.U, Uparse; M, Mothur. |
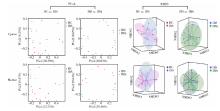
2.4.1 HC组与IBS组比较 分别对Uparse平台和Mothur平台分析所得的HC组和IBS组菌群数据进行组间比较(图4), NMDS分析三维图中可以看出HC组和IBS组肠道菌群组成不同, 但是差异无统计学意义。HC组和IBS组肠道菌群结构差异经AMOVA分析均无统计学意义(Uparse平台HC组与IBS组比较, F =0.98, P =0.445, Mo-thur平台HC组与IBS组比较, F =0.82, P =0.646)。
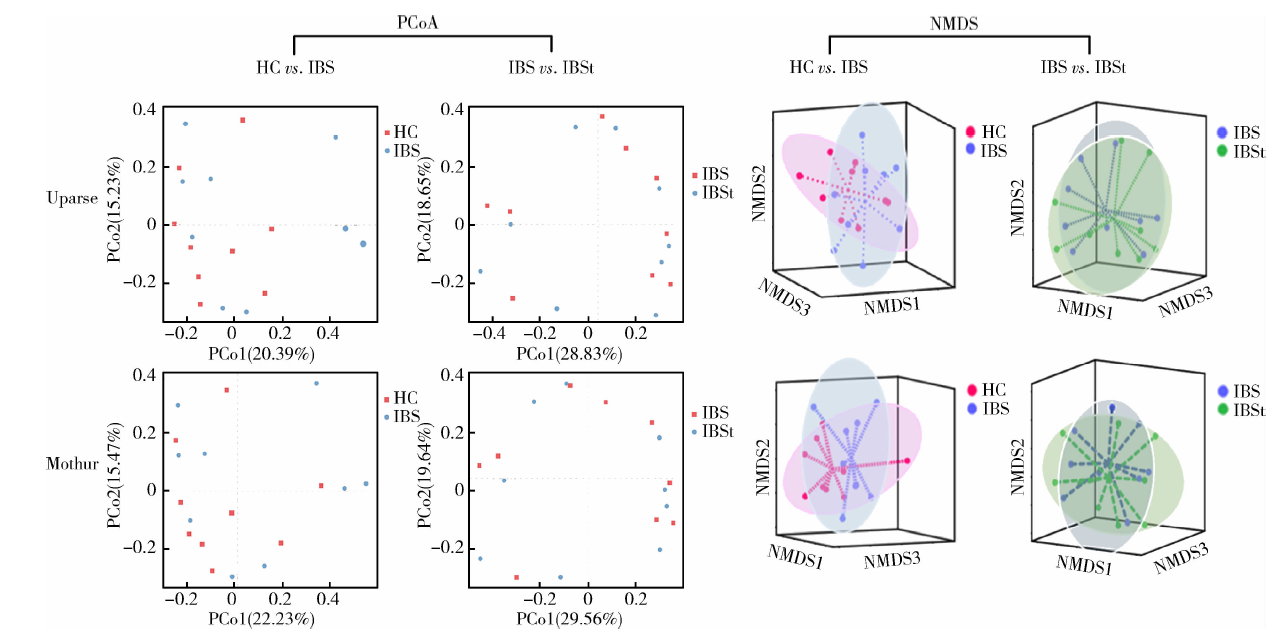 | 图4 不同平台分析结果的组间PCoA和NMDS分析Figure 4 PCoA and NMDS analysis for the results of two pipelines in groups HC, healthy control; IBS: irritable bowel syndrome; IBSt, IBS-treatment; PCoA, principal co-ordinatesanalysis; PCo, principal co-ordinates; NMDS, nonmetric multidimensional scaling. HC vs. IBS, HC group compared with IBS group; IBS vs. IBSt, IBS group compared with IBSt group. |
2.4.2 IBS组与IBSt组比较 分别对Uparse平台和Mothur平台分析所得的IBS组和IBSt组粪便菌群测序结果进行分析比较, PCoA分析结果显示, 两个平台分析中的IBS组和IBSt组肠道菌群组成差异无统计学意义, Uparse平台IBS组和IBSt组比较, F =0.47, P =0.926, Mothur平台IBS组和IBSt组比较, F =0.37, P =0.961。
2.4.3 不同平台的组间差异物种分析 分别对不同平台HC组和IBS组、IBS组和IBSt组菌群数据进行LEFSe分析(图5)。Uparse平台数据中, HC组和IBS组比较有10个差异菌, 其中HC组肠道菌群表现为Nitrosomonas, Paraprevotella丰度增高, IBS组肠道菌群表现为Pseudoalteromonadaceae, Anaerotruncus, Oxalobacteraceae, Pseudoalteromonas, Anae-rofilum, Acidaminococcus, Subdoligranulum和Unclassfied Coriobacteriaceae丰度增高; IBS组和IBSt组比较有11个差异菌, 这11个差异菌都是在IBS组中丰度升高, 例如Pseudobutyricibrio, Clostridiaceae 1, Clostridiumsensustricto 1, Unclassfied Clostridiales, Nospiraceae ND3007 group, Lachnospiraceae UCG-008, Weissella, Leuconostocaceae, Marvinbryantia, Lachnospiraceae UCG-001, Istensenellaceae R-7 group。对于Mothur平台分析的数据, HC组和IBS组比较有11个菌存在差异, 其中HC组为Roseburia 62丰度升高, IBS组为Butyricicoccus, Moraxellaceae, Erythrobacteraceae, Parabacteroides, Paenibacillus, Paenibacillaceae 4, Escherichia shigella, Enterobacteraceae, Unclassfied Alphaproteobacteria, Unclassfied Erythrobacteraceae丰度升高; IBS组和IBSt组比较无差异菌属。
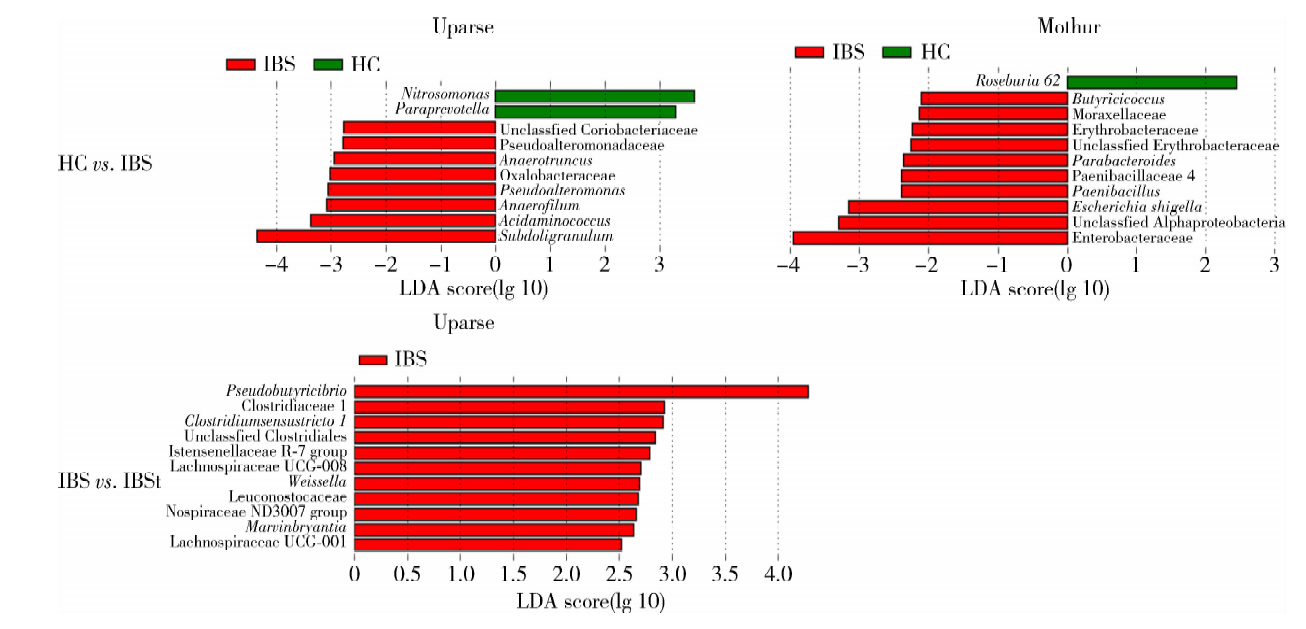 | 图5 不同平台分析结果的组间LEfSe分析Figure 5 LEfSe analysis for the results of two pipelines in groups HC, healthy control; IBS, irritable bowel syndrome; IBSt, IBS-treatment. HC vs. IBS, HC group compared with IBS group; IBS vs. IBSt, IBS group compared with IBSt group; LDA, linear discriminant analysis. |
虽然两个平台所比对的均为同一版本数据库, 但是所得OUTs比对的细菌分类存在很大差异, 这种差异在粪便菌群门水平上并不显著, 但随着肠道菌群物种分类的细化(科、属水平), 这种差异越发突出。在属水平, 两个平台不同的菌属个数分别高达总样本菌属个数的46.79%(Uparse平台)和30.44%(Mothur平台), 分类学的差异对单个样本的菌群结构影响尤为严重, 以HC012为例, 在科水平, Uparse平台结果中HC012样本Ruminococcaceae丰度占30.60%, 而Mothur平台结果中该菌门丰度仅占前者的一半(14.33%); 在属水平, Subdoligranulum的丰度在Mothur平台丰度为0, 而在Uparse平台分析的结果中其丰度为1.43%。Subdoligranulum属于Ruminococcaceae, 这说明样本的科水平的丰度差异可以直接影响该菌科分类下的菌属水平的结果, 也直接影响了该菌群发育树的丰度。
相比较而言, Uparse平台所得的细菌分类更少。在门水平, Uparse平台分析结果比Mothur平台少了1个TM7菌门, 该菌门在人的口腔、胆汁、消化道、粪便中均有发现, 在大鼠和小鼠的粪便、盲肠内容物中也存在, 有研究发现TM7可以分解1, 4-二恶烷[10, 11, 12]。而在属水平, Uparse平台比Mothur平台总的菌属分类少了16个。
造成以上差异的原因可能与Uparse平台和Mothur平台对于粪便菌群高通量测序结果的分析过程不同有关。Uparse平台中将测序数据分析至OTUs的过程中, 首先对测序数据fastq文件进行拼接、筛选, 固定在一定的长度, 然后通过GREEDY算法对嵌合体进行筛选得到OUTs聚类, 该方法的优点是在使用新的标记基因之前不用收集参考序列, 之后再与Silva数据库进行比对从而得到菌群分类数据; 而Mothur对拼接后的fastq文件先进行校准、筛选等, 通过数据库收集V3~V4序列长度的参考序列, 后再调用VSEARCH算法来分类并且检查嵌合的数据, 以序列丰度作为参考得到OTUs数据, 之后再与Silva数据库进行比对从而得到菌群分类数据。Allali等[13]通过比较Uparse和Qiime平台分析鸡的盲肠内容物微生物结构的结果, 发现Uparse平台分析得到的细菌种类少, 菌群发育树多样性更低, 本研究亦得出相似结论。
有多项研究[3, 8, 13]表明IBS患者粪便菌群与健康对照粪便菌群差异有统计学意义, 菌群结构的改变与IBS患者内脏敏感性、症状严重程度、血浆炎症因子水平等因素存在相关性, 利福昔明可能通过改变肠道菌群结构治疗IBS。本研究纳入样本的临床数据显示, IBS组较HC组临床症状积分显著升高, 然而就本研究纳入的样本数据而言, HC组和IBS组以及IBS组和IBSt组的肠道菌群结构在两个平台分析的结果中差异都无统计学意义, 这可能与本研究纳入样本较少相关, 由于肠道菌群的多样性和不稳定性, 少样本研究很难缓冲个体差异。对于差异物种分析, 两个平台均能得到HC组和IBS组存在差异的菌属, 但是不尽相同。Uparse平台发现在IBS组中增多的差异性菌属Subdoligranulum曾被报道与感染后IBS以及儿童IBS的发病相关[14, 15]; Mothur平台发现在IBS组中增多的差异性菌属Parabacteroides, Enterobacteraceae曾被报道在IBS、炎性肠病患者粪便中丰度增加[16, 17, 18, 19, 20], Escherichia shigella除了与以上两种疾病相关外, 还是旅行者腹泻的主要原因[21, 22]。比较IBS组和IBSt组菌群差异性菌属发现, Uparse平台分析的IBS组中增多的差异性菌属有11个而Mothur平台则无。Uparse平台发现在IBS组中增加的Weissella和Clostridium与肠炎的发病相关[23], Leuconostocaceae在食物过敏以及IBS的患者粪便中丰度增加[24]。利福昔明是肠道不吸收的抗生素, 对肠道细菌有明显抑制作用, 治疗后肠道菌群多样性显著降低(表1), 其菌群会有明显的变化。曾有研究[25, 26]通过分析标准数据发现, Uparse平台对于模糊数据和噪点数据的去除能力更强, 因此Uparse平台更能够发现本研究中IBS患者治疗前后菌属的改变。
通过比较Uparse平台和Mothur平台对于同一批粪便菌群16S rRNA高通量测序数据的分析发现, 不同平台结果在细菌分类学及发育树方面差异有统计学意义, 这种差异会随着分类的深入而增大, 相比较而言, Mothur平台能够得到更多的细菌分类。此外, 不同平台发现组间差异性菌属的能力不尽相同, 对于本研究, Uparse平台发现差异性菌属的能力更强, 因此, 在进行菌群研究时, 需要注意菌群分析方法的应用与选择。
The authors have declared that no competing interests exist.
| [1] |
|
| [2] |
|
| [3] |
|
| [4] |
|
| [5] |
|
| [6] |
|
| [7] |
|
| [8] |
|
| [9] |
|
| [10] |
|
| [11] |
|
| [12] |
|
| [13] |
|
| [14] |
|
| [15] |
|
| [16] |
|
| [17] |
|
| [18] |
|
| [19] |
|
| [20] |
|
| [21] |
|
| [22] |
|
| [23] |
|
| [24] |
|
| [25] |
|
| [26] |
|