Journal of Peking University (Health Sciences) ›› 2024, Vol. 56 ›› Issue (2): 223-229. doi: 10.19723/j.issn.1671-167X.2024.02.004

Previous Articles     Next Articles

Related factors and equity of health status among floating population in China based on geographic information system analysis

Xiaohan LIU1,Fan YANG1,Xindi WANG2,Ning HUANG1,Taozhu CHENG1,Jing GUO1,*()   

  1. 1. Department of Health Policy and Management, School of Public Health, Peking University Health Science Center, Beijing 100191, China
    2. Department of Sociology, School of Sociology, Huazhong University of Science and Technology, Wuhan 430074, China
  • Received:2022-12-05 Online:2024-04-18 Published:2024-04-10
  • Contact: Jing GUO E-mail:jing624218@163.com

Abstract:

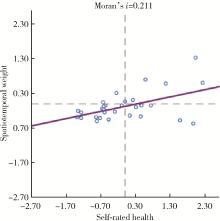
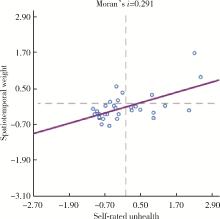
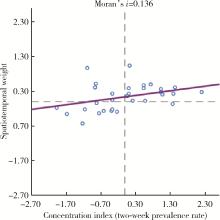
Objective: To understand the health status, influencing factors and spatial distribution of the Chinese floating population and to evaluate the health equity of the floating population. Methods: All the data were collected from the 2017 Migrant Population Dynamic Monitoring Survey in China, binary Logistic regression was used to analyze the factors that might affect the health of the floating population, and the concentration index method was used to evaluate the health equity of the floating population. Spatial autocorrelation analyses the spatial aggregation of health status and health equity. Results: The unhealthy rate of the floating population in China was 2.71%. Age and gender show a statistically significant impact on self-rated health; that is, as age increases, the self-rated health of the migrant population gradually deteriorates, and women are more likely to think that they are unhealthy. Fairness analysis shows that the concentration index of the floating population is 0.021 7, the urban household registration floating population is 0.021 6, and the rural household registration floating population is 0.021 9. It is shown that the fairness of the health status of the floating population is biased towards the high-income class, and the rural household registration floating population' s health unfairness is greater than that of the urban household registration migration population. Moreover, Moran' s i=0.211 for self-rated health and Moran' s i=0.291 for the unhealthy rate indicate that self-rated health has a spatial aggregation trend. Moran' s i=0.136 showed the characteristics of spatial clustering, and the two-week prevalence fairness of the floating population was mainly in the northern and southeastern coastal areas. Conclusion: In general, the health status of the floating population in China is relatively good. The main influencing factors of health included gender and age. The central tendency of health inequity is reflected in the southeast coastal and northern regions, which are characterized by poverty. Attention to spatial aggregation is not only helpful to analyze the reasons of floating population, but also to study the health differences between different regions and health-related factors, to improve the overall health level of the whole population.

Key words: Floating population, Health equity, Influencing factors, Spatial differences

CLC Number: 

  • R195

Table 1

demographic of floating population"

Variables Definition Frequency Percentage
Self-rated health Health=0 165 263 97.29
Unhealth=1 4 602 2.71
Gender Female=0 82 066 48.31
Male=1 87 799 51.69
Residence Rural=1 132 555 78.04
Non-rural=0 37 310 21.96
Education Primary school and below=1 28 965 17.05
Middle school=2 74 173 43.67
High school=3 37 187 21.89
University and above =4 29 540 17.39
Marriage status Else(single/divorce et al)=0 31 882 18.77
Married=1 137 983 81.23
Health insurance status Yes=1 155 996 93.50
No=0 10 848 6.50
Range of population flow Trans-provincial flow=1 83 700 49.27
Inter-city mobility=2 55 993 32.96
Inter-county mobility=3 30 172 17.76
Reasons of population flow For work=1 142 016 83.61
For family=2 14 674 8.64
For retirement=3 13 175 7.76
Ill within two weeks Yes=1 158 873 93.53
No=0 10 992 6.47
Location Northeast=1 12 997 7.65
West=2 58 916 34.68
Middle=3 28 988 17.07
East=4 68 964 40.60

Table 2

Logistic regression analysis of health status influencing factors (n=137 000)"

Variables OR 95%CI
Gender(ref:Female) 0.829* 0.704-0.977
Age 1.074# 1.065-1.082
Residence(ref:Non-rural) 1.001 0.776-1.290
Education(ref:Primary school and below)
  Middle school 0.514# 0.426-0.620
  High school 0.324# 0.245-0.429
  University and above 0.202# 0.119-0.343
Marriage status[ref:Else(single/divorce et al)] 1.055 0.812-1.372
Health insurance status(ref:No) 0.994 0.675-1.464
Range of population flow(ref:Trans- provincial flow)
  Inter-city mobility 0.819 0.676-0.993
  Inter-county mobility 1.213 1.010-1.456
  Flow duration 1.010* 1.001-1.020
Reasons of population flow(ref:For work)
  For family 1.248 0.856-1.818
  For retirement 1.681 1.048-2.696
  Income 0.838# 0.809-0.869
Location(ref:Northeast)
  West 1.028 0.848-1.246
  Middle 0.755 0.604-0.943
  East 0.499# 0.399-0.623

Table 3

Analysis of health equity of subjects under different household registration groups"

Household groupUrban Rural Total
N Self-rated unhealthy, n(%) N Self-rated unhealthy, n(%) N Self-rated unhealthy, n(%)
Low-income 4 214 121 (2.87) 24 430 915 (3.75) 28 644 1 036 (3.62)
Low to middle income 6 381 60 (0.94) 27 532 249 (0.90) 33 913 409 (1.21)
Middle-income 5 775 49 (0.85) 21 603 197 (0.91) 27 378 246 (0.90)
Middle to high income 4 923 30 (0.61) 16 685 128 (0.77) 21 608 158 (0.73)
High-income 8 381 27 (0.32) 19 482 116 (0.60) 27 863 143 (0.51)
P/CI SE < 0.001/0.014 < 0.001/0.033 < 0.001/0.013

Table 4

Spatial regression factors related to health equity"

Variables β SE t P
Constant -0.202 0.719 -0.280 0.783
Age 0.003 0.009 0.380 0.709
Gender (ref:Female) 0.950 0.619 1.535 0.146
Residence (ref:Non-rural) -0.263 0.097 -2.715 0.016
Marriage status [ref:Else (single/divorce et al)] 0.661 0.251 2.631 0.019
Health insurance status (ref:No) -0.312 0.412 -0.757 0.461
Reasons of population flow (ref:For work)
  For family -0.298 0.347 -0.859 0.404
  For retirement 0.269 0.468 0.576 0.573
Education (ref:Primary school and below)
  Middle school -0.353 0.315 -1.121 0.280
  High school 0.449 0.345 1.302 0.213
  University and above -0.197 0.277 -0.710 0.489
Range of population flow (ref:Trans-provincial flow)
  Inter-city mobility -0.309 0.090 -3.453 0.004
  Inter-county mobility 0.006 0.071 0.087 0.931
Flow duration -0.032 0.012 -2.724 0.016
Income < 0.001 < 0.001 -1.213 0.244

Figure 1

Moran scatter chart of self-rated health of floating population"

Figure 2

Moran scatter chart of unhealth rate of floating population"

Figure 3

Moran scatter chart of concentration index of floating population"

1 程梦瑶.中国流动人口的迁移转变与多元化发展[J].兰州学刊,2021,42(7):120-132.
doi: 10.3969/j.issn.1005-3492.2021.07.008
2 木永跃.流动人口社会风险治理: 理论与路径[J].上海行政学院学报,2021,22(2):91-101.
doi: 10.3969/j.issn.1009-3176.2021.02.010
3 Wagstaff A .Poverty and health sector inequalities[J].Bull World Health Organ,2002,80(2):97-105.
4 宋全成, 张倩.中国老年流动人口健康状况及影响因素研究[J].中国人口科学,2018,38(4):81-92.
5 胡婉侠, 王丽, 王翠连, 等.流动老人自评健康状况及影响因素分析[J].中国农村卫生事业管理,2020,40(9):664-668.
doi: 10.3969/j.issn.1005-5916.2020.09.013
6 何南芙, 普亚姣, 李忠起, 等.中国流动老年人口健康状况影响因素及公平性[J].中国老年学杂志,2021,41(19):4398-4401.
doi: 10.3969/j.issn.1005-9202.2021.19.070
7 Connolly S , O'Reilly D , Rosato M .Increasing inequalities in health: Is it an artefact caused by the selective movement of people[J].Social Sci Med,2007,64(10):2008-2015.
doi: 10.1016/j.socscimed.2007.02.021
8 国家统计局. 中华人民共和国统计法[EB/OL]. [2023-09-30]. https://www.gov.cn/govweb/fwxx/bw/tjj/content_504312.htm.
9 黄云, 任国强, 周云波.收入不平等对农村居民身心健康的影响: 基于CGSS2015数据的实证分析[J].农业技术经济,2019,38(3):25-37.
10 刘瑞平, 李建新.我国中老年人健康不平等的变化趋势及相关因素分解[J].人口与发展,2022,28(5):43-55.
11 梁维萍, 郑建中, 韩颖, 等.健康与卫生保健的公平性及其测量方法评介[J].中国农村卫生事业管理,2007,27(10):742-744.
doi: 10.3969/j.issn.1005-5916.2007.10.007
12 任国强, 胡梦雪.跨省流动人口健康自评状况及其影响因素分析: 基于2014年全国流动人口动态监测调查数据[J].中国卫生事业管理,2021,38(8):587-593, 625.
13 薛利, 马天佩, 张文婕.城市新移民自评健康状况及其影响因素分析[J].中华疾病控制杂志,2018,22(11):1168-1172.
14 潘竞虎, 张佳龙, 张勇.甘肃省区域经济空间差异的ESDA-GIS分析[J].西北师范大学学报(自然科学版),2006,42(6):83-87.
15 薛莉萍, 范慧, 郭静.流动人口健康教育现状及其影响因素研究[J].中国健康教育,2017,33(9):771-774, 796.
16 Lu Y , Qin L .Healthy migrant and salmon bias hypotheses: A study of health and internal migration in China[J].Soc Sci Med,2014,102(4):41-48.
17 李雨潼.中国老年流动人口特征及社会融入分析[J].社会科学战线,2021,44(3):270-275.
18 张玲玲.上海金山区中学生2012与2017年日常饮食和缺乏体力活动行为比较[J].中国学校卫生,2019,40(6):913-916.
19 段成荣, 谢东虹, 吕利丹.中国人口的迁移转变[J].人口研究,2019,43(2):12-20.
20 李佳.基于差异性的流动人口社会融合研究[J].东南学术,2021,34(1):106-112.
21 张检, 蔡金龙, 何中臣, 等.我国流动人口健康教育现状及其影响因素分析[J].中国健康教育,2021,37(4):291-296.
[1] Silan AN,Qunyi ZHENG,Kai WANG,Shan GAO. Characteristics and influencing factors of early pain in patients after total knee arthroplasty [J]. Journal of Peking University (Health Sciences), 2024, 56(1): 167-173.
[2] JING Ri-ze, ZHANG Hu-yang, XU Ting-ting, ZHANG Lu-yu, FANG Hai. Study on the efficiency of tertiary public hospitals and its influencing factors in Beijing [J]. Journal of Peking University(Health Sciences), 2018, 50(3): 408-415.
[3] ZHAO Yu-wei,WU Ming. Analysis on status and determinants of outpatient service utilization of rural floating population in Beijing at different residence time [J]. Journal of Peking University(Health Sciences), 2017, 49(3): 476-482.
[4] ZHANG Lei, WU Ming. Analysis on status and determinants of self-treatment of rural floating population in Beijing [J]. Journal of Peking University(Health Sciences), 2015, 47(3): 455-458.
Viewed
Full text


Abstract

Cited

  Shared   
  Discussed   
[1] Author. English Title Test[J]. Journal of Peking University(Health Sciences), 2010, 42(1): 1 -10 .
[2] . [J]. Journal of Peking University(Health Sciences), 2009, 41(4): 456 -458 .
[3] . [J]. Journal of Peking University(Health Sciences), 2009, 41(2): 125 -128 .
[4] . [J]. Journal of Peking University(Health Sciences), 2009, 41(2): 135 -140 .
[5] . [J]. Journal of Peking University(Health Sciences), 2009, 41(2): 158 -161 .
[6] . [J]. Journal of Peking University(Health Sciences), 2009, 41(2): 188 -191 .
[7] . [J]. Journal of Peking University(Health Sciences), 2009, 41(1): 52 -55 .
[8] . [J]. Journal of Peking University(Health Sciences), 2009, 41(1): 109 -111 .
[9] . [J]. Journal of Peking University(Health Sciences), 2009, 41(3): 297 -301 .
[10] . [J]. Journal of Peking University(Health Sciences), 2009, 41(4): 459 -462 .