Journal of Peking University (Health Sciences) ›› 2025, Vol. 57 ›› Issue (3): 456-464. doi: 10.19723/j.issn.1671-167X.2025.03.008

Previous Articles     Next Articles

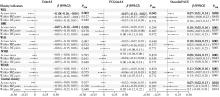
Association between DNA methylation clock and obesity-related indicators: A longitudinal twin study

Shunkai LIU1,2, Weihua CAO1,2, Jun LV1,2, Canqing YU1,2, Tao HUANG1,2, Dianjianyi SUN1,2, Chunxiao LIAO1,2, Yuanjie PANG1,2, Runhua HU1,2, Ruqin GAO3, Min YU4, Jinyi ZHOU5, Xianping WU6, Yu LIU7, Wenjing GAO1,2,*(), Liming LI1,2   

  1. 1. Department of Epidemiology and Biostatistics, Peking University School of Public Health, Beijing 100191, China
    2. Key Laboratory of Epidemiology of Major Diseases (Peking University), Ministry of Education, Beijing 100191, China
    3. Qingdao Center for Disease Control and Prevention, Qingdao 266033, Shandong, China
    4. Zhejiang Center for Disease Control and Prevention, Hangzhou 310051, China
    5. Jiangsu Center for Disease Control and Prevention, Nanjing 210008, China
    6. Sichuan Center for Disease Control and Prevention, Chengdu 610041, China
    7. Heilongjiang Center for Disease Control and Prevention, Harbin 150090, China
  • Received:2025-02-08 Online:2025-06-18 Published:2025-06-13
  • Contact: Wenjing GAO
  • Supported by:
    National Natural Science Foundation of China(82373659); National Natural Science Foundation of China(82073633); National Natural Science Foundation of China(81573223); Special Fund for Health Science Research in the Public Welfare(201502006); Special Fund for Health Science Research in the Public Welfare(201002007)

RICH HTML


Abstract:

Objective: To explore the relationship between obesity indicators and DNA methylation clocks acceleration, and to analyze their temporal sequence. Methods: Data were obtained from two surveys conducted in 2013 and 2017-2018 by the Chinese National Twin Registry. Peripheral blood DNA methylation data were measured using the Illumina Infinium Human Methylation 450K BeadChip and EPIC BeadChip. DNA methylation clocks/acceleration metrics (GrimAA, PCGrimAA and DunedinPACE) were calculated using the DNA methylation online tool (https://dnamage.genetics.ucla.edu/) or R code provided by researchers. Obesity indicators included weight, body mass index (BMI), waist circumference, waist-hip ratio, and waist-height ratio. A total of 1 070 twin individuals were included in the cross-sectional analysis, comprising 378 monozygotic (MZ) twin pairs and 155 dizygotic (DZ) twin pairs for within-pair analysis. Mixed-effects models were used to examine the associations between obesity indicators and DNA methylation clocks, as well as their acceleration measures. The longitudinal analysis included 314 twin individuals, comprising 95 MZ twin pairs and 62 DZ twin pairs for within-pair analysis. Cross-lagged panel models were applied to further explore the temporal relationships between obesity and DNA methylation clock indicators. All analyses were conducted both in the full twin sample and separately within MZ and DZ twin pairs. Results: In the cross-sectional analysis population, monozygotic twins accounted for 71.0%, males for 68.0%, and the mean chronological age was (49.9±12.1) years. In the longitudinal analysis population, monozygotic twins accounted for 60.5%, males for 60.8%, with a mean baseline chronological age of (50.4±10.2) years and a mean follow-up duration of (4.6±0.6) years. Except for the waist-to-hip ratio, which was significantly higher at follow-up compared with baseline, no statistically significant differences were observed in the means of other obesity indicators between baseline and follow-up. Correlation analysis revealed that weight, BMI, waist circumfe-rence, waist-hip ratio (WHR), and waist-height ratio (WHtR) were positively correlated with DunedinPACE in all the twins, with WHtR showing the strongest association (β=0.21, 95%CI: 0.11 to 0.31). Weight and BMI were negatively associated with GrimAA (β=-0.03, 95%CI: -0.05 to -0.01; β=-0.07, 95%CI: -0.12 to -0.02), while weight was negatively associated with PCGrim- AA (β=-0.02, 95%CI: -0.03 to 0.00). However, within-twin-pair analyses showed no statistically significant correlations. Cross-lagged panel model analysis indicated that higher baseline weight might lead to increased GrimAA at follow-up, while elevated baseline weight, BMI, and waist circumference might increase PCGrimAA. Higher baseline WHR was associated with increased DunedinPACE at follow-up. Conclusion: Obesity indicators correlate with DNA methylation clock acceleration metrics. Baseline obesity may influence changes in certain DNA methylation clock indicators over time, suggesting that obesity could exert long-term health effects by accelerating DNA methylation aging. However, these associations may be confounded by shared genetic or environmental factors among the twins.

Key words: Obesity, DNA methylation, Aging, Twin study, Genetic epigenesis

CLC Number: 

  • R181.33

Table 1

The characteristics of study participants"

Characteristics Overall samples (n=1 070) Baseline (n=314) Follow-up (n=314) P value
Demographic characteristics
  Chronological age/years, ${\bar x}$±s 49.9±12.2 50.4±10.2 55.0±10.1 < 0.001
  Gender, n(%)
    Male 728 (68.0) 191 (60.8)
    Female 342 (32.0) 123 (39.2)
  Zygosity, n(%)
    MZ 760 (71.0) 190 (60.5)
    DZ 310 (29.0) 124 (39.5)
  Smoking status, n(%) 0.450
    Never smoked 585 (54.7) 190 (60.5) 188 (59.9)
    Former smoker 138 (12.9) 26 (8.3) 35 (11.1)
    Current smoker 347 (32.4) 98 (31.2) 91 (29.0)
  Alcohol consumption, n(%) < 0.001
    Never drank 549 (51.3) 148 (47.1) 89 (28.3)
    Former drinker 71 (6.6) 10 (3.2) 139 (44.3)
    Current drinker 450 (42.1) 156 (49.7) 86 (27.4)
  Physical activity level, n(%) < 0.001
    High 519 (48.5) 43 (13.7) 117 (37.3)
    Moderate 186 (17.4) 79 (25.2) 69 (22.0)
    Low 365 (34.1) 192 (61.1) 128 (40.8)
Obesity indicators
  Weight/kg, ${\bar x}$±s 65.0±12.1 62.3±11.6 62.4±11.4 0.899
  BMI/(kg/m2), ${\bar x}$±s 24.8±3.7 24.3±3.5 24.3±3.5 0.782
  Waist circumference/cm, ${\bar x}$±s 87.0±10.1 85.4±9.7 86.2±9.4 0.292
  Waist-hip ratio, ${\bar x}$±s 0.9 ±0.1 0.9±0.1 0.9±0.1 0.001
  Waist-height ratio, ${\bar x}$±s 0.5±0.1 0.5±0.1 0.5±0.1 0.260
  BMI classification, n(%) 0.962
    Underweight 35 (3.3) 14 (4.5) 16 (5.1)
    Normal 539 (50.9) 168 (54.4) 165 (52.9)
    Overweight 404 (38.2) 112 (36.2) 117 (37.5)
    Obese 80 (7.6) 15 (4.9) 14 (4.5)
  Central obesity, n(%) 1.000
    Yes 485 (45.5) 124 (39.5) 123 (39.2)
    No 582 (54.5) 190 (60.5) 191 (60.8)
DNAm clock
  GrimAA/years, ${\bar x}$±s 0.00±3.86 0.02±4.10 0.04±3.73 0.941
  DunedinPACE, ${\bar x}$±s 1.13±0.11 1.13±0.10 1.14±0.11 0.232
  PCGrimAA/years, ${\bar x}$±s 0.00±2.62 -0.15±2.71 0.15±2.71 0.175

Table 2

Cross-sectional associations between obesity indicators and GrimAA or PCGrimAA"

Characteristics GrimAA (Model 1) GrimAA (Model 2) PCGrimAA (Model 3)
β(95%CI) PFDR β(95%CI) PFDR β(95%CI) PFDR
Weight -0.03 (-0.05, -0.01) 0.005 -0.03 (-0.05, -0.01) 0.006 -0.02 (-0.03, -0.00) 0.043
BMI -0.09 (-0.14, -0.03) 0.007 -0.07 (-0.12, -0.02) 0.024 -0.03 (-0.06, 0.01) 0.273
Waist circumference -0.02 (-0.04, 0.00) 0.071 -0.02 (-0.04, 0.00) 0.077 -0.01 (-0.02, 0.01) 0.512
Waist-hip ratio -0.87 (-3.93, 2.19) 0.577 -0.79 (-3.69, 2.11) 0.595 0.28 (-1.66, 2.22) 0.820
Waist-height ratio -2.69 (-5.91, 0.53) 0.119 -2.20 (-5.26, 0.85) 0.183 -0.24 (-2.28, 1.81) 0.820
Obesity -0.75 (-1.27, -0.24) 0.009 -0.58 (-1.07, -0.10) 0.044 -0.23 (-0.55, 0.09) 0.273
Central obesity -0.60 (-1.18, -0.03) 0.068 -0.56 (-1.11, -0.01) 0.077 -0.28 (-0.64, 0.08) 0.273

Table 3

Cross-sectional associations between obesity indicators and DunedinPACE"

Characteristic Model 1 Model 2
β(95%CI) PFDR β(95%CI) PFDR
Weight 0.000 7 (0.000 1, 0.001 3) 0.028 0.000 7 (0.000 1, 0.001 3) 0.026
BMI 0.003 0 (0.001 4, 0.004 7) < 0.001 0.003 2 (0.001 5, 0.004 8) < 0.001
Waist circumference 0.001 1 (0.000 5, 0.001 7) < 0.001 0.001 1 (0.000 5, 0.001 7) 0.001
Waist-hip ratio 0.168 8 (0.073 9, 0.263 7) < 0.001 0.162 4 (0.068 0, 0.256 9) 0.001
Waist-height ratio 0.208 2 (0.108 4, 0.307 9) < 0.001 0.208 7 (0.109 5, 0.307 9) < 0.001
Obesity 0.033 4 (0.017 9, 0.048 9) < 0.001 0.035 8 (0.020 5, 0.051 0) < 0.001
Central obesity 0.024 8 (0.006 9, 0.042 7) 0.008 0.026 4 (0.008 8, 0.044 0) 0.004

Figure 1

Cross-sectional correlation between GrimAA, PCGrimAA, DunedinPACE and obesity indicators in all twins and within-pair analysis WEI, weight; BMI, body mass index; WAI, waist circumference; WHR, waist-hip ratio; WHtR, waist-height ratio; MZ, monozygotic twins; DZ, dizygotic twins; GrimAA, GrimAge acceleration; PCGrimAA, principle component GrimAA; β, regression coefficient; CI, confidence interval; FDR, false discovery rate."

Table 4

Cross-lagged relationships between obesity indicators and DNAm clock metrics"

Characteristics Obesity indicators at baseline → DNAm clock metrics at follow-up DNAm clock metrics at baseline → Obesity indicators at follow-up Fit statistics
ρ1 PFDR ρ2 PFDR SRMR CFI
GrimAA
Weight 0.04 0.035 0.02 0.996 0.04 0.96
BMI 0.05 0.414 0.01 0.996 0.05 0.94
Waist circumference 0.03 0.250 0.01 0.996 0.05 0.92
Waist-hip ratio 2.46 0.414 0.00 0.996 0.05 0.88
Waist-height ratio 0.08 0.974 0.00 0.996 0.05 0.92
PCGrimAA
Weight 0.03 < 0.001 0.00 0.966 0.01 1.00
BMI 0.07 0.022 0.01 0.966 0.02 0.99
Waist circumference 0.02 0.040 0.02 0.966 0.02 0.98
Waist-hip ratio 0.95 0.542 0.00 0.966 0.03 0.97
Waist-height ratio 1.99 0.226 0.00 0.966 0.02 0.99
DunedinPACE
Weight 0.00 0.310 -1.06 0.999 0.02 1.00
BMI 0.00 0.310 0.14 0.999 0.02 1.00
Waist circumference 0.00 0.088 0.01 0.999 0.02 0.99
Waist-hip ratio 0.17 0.030 0.02 0.999 0.03 0.98
Waist-height ratio 0.12 0.088 0.01 0.999 0.02 1.00
1
Rutledge J , Oh H , Wyss-Coray T . Measuring biological age using omics data[J]. Nat Rev Genet, 2022, 23 (12): 715- 727.

doi: 10.1038/s41576-022-00511-7
2
Levine ME . Modeling the rate of senescence: Can estimated biological age predict mortality more accurately than chronological age?[J]. J Gerontol A Biol Sci Med Sci, 2013, 68 (6): 667- 674.

doi: 10.1093/gerona/gls233
3
Lu AT , Quach A , Wilson JG , et al. DNA methylation GrimAge strongly predicts lifespan and healthspan[J]. Aging, 2019, 11 (2): 303- 327.

doi: 10.18632/aging.101684
4
Belsky DW , Caspi A , Corcoran DL , et al. DunedinPACE, a DNA methylation biomarker of the pace of aging[J]. ELife, 2022, 11, e73420.

doi: 10.7554/eLife.73420
5
Higgins-Chen AT , Thrush KL , Wang Y , et al. A computational solution for bolstering reliability of epigenetic clocks: Implications for clinical trials and longitudinal tracking[J]. Nat Aging, 2022, 2 (7): 644- 661.

doi: 10.1038/s43587-022-00248-2
6
Pang APS , Higgins-Chen AT , Comite F , et al. Longitudinal study of DNA methylation and epigenetic clocks prior to and following test-confirmed COVID-19 and mRNA vaccination[J]. Front Genet, 2022, 13, 819749.

doi: 10.3389/fgene.2022.819749
7
Faul JD , Kim JK , Levine ME , et al. Epigenetic-based age acce-leration in a representative sample of older Americans: Associations with aging-related morbidity and mortality[J]. Proc Natl Acad Sci USA, 2023, 120 (9): e2215840120.

doi: 10.1073/pnas.2215840120
8
Xu S , Lu F , Gao J , et al. Inflammation-mediated metabolic regulation in adipose tissue[J]. Obes Rev, 2024, 25 (6): e13724.

doi: 10.1111/obr.13724
9
Xu L , Yan X , Zhao Y , et al. Macrophage polarization mediated by mitochondrial dysfunction induces adipose tissue inflammation in obesity[J]. Int J Mol Sci, 2022, 23 (16): 9252.

doi: 10.3390/ijms23169252
10
Kitada M , Koya D . Autophagy in metabolic disease and ageing[J]. Nat Rev Endocrinol, 2021, 17 (11): 647- 661.

doi: 10.1038/s41574-021-00551-9
11
Grun LK , Teixeira NDR Jr , Mengden LV , et al. TRF1 as a major contributor for telomeres' shortening in the context of obesity[J]. Free Radic Biol Med, 2018, 129, 286- 295.

doi: 10.1016/j.freeradbiomed.2018.09.039
12
Gielen M , Hageman GJ , Antoniou EE , et al. Body mass index is negatively associated with telomere length: A collaborative cross-sectional meta-analysis of 87 observational studies[J]. Am J Clin Nutr, 2018, 108 (3): 453- 475.

doi: 10.1093/ajcn/nqy107
13
Blüher M . An overview of obesity-related complications: The epidemiological evidence linking body weight and other markers of obesity to adverse health outcomes[J]. Diabetes Obes Metab, 2025, 27 (Suppl 2): 3- 19.
14
Lin WY , Wang YC , Teng IH , et al. Associations of five obesity metrics with epigenetic age acceleration: Evidence from 2, 474 Taiwan Biobank participants[J]. Obesity (Silver Spring), 2021, 29 (10): 1731- 1738.

doi: 10.1002/oby.23255
15
Kresovich JK , Garval EL , Martinez Lopez AM , et al. Associations of body composition and physical activity level with multiple mea-sures of epigenetic age acceleration[J]. Am J Epidemiol, 2021, 190 (6): 984- 993.

doi: 10.1093/aje/kwaa251
16
Gao W , Cao W , Lv J , et al. The Chinese National Twin Registry: A 'gold mine' for scientific research[J]. J Intern Med, 2019, 286 (3): 299- 308.

doi: 10.1111/joim.12926
17
中华人民共和国卫生和计划生育委员会. WS/T428-2013成人体重判定[S]. 北京: 中国标准出版社, 2013.
18
Wang B , Gao W , Yu C , et al. Determination of zygosity in adult Chinese twins using the 450K methylation array versus questionnaire data[J]. PLoS One, 2015, 10 (4): e0123992.

doi: 10.1371/journal.pone.0123992
19
Ryan J , Wrigglesworth J , Loong J , et al. A systematic review and meta-analysis of environmental, lifestyle, and health factors asso-ciated with DNA methylation age[J]. J Gerontol A Biol Sci Med Sci, 2020, 75 (3): 481- 494.

doi: 10.1093/gerona/glz099
20
Li C , Wang Z , Hardy T , et al. Association of obesity with DNA methylation age acceleration in African American mothers from the InterGEN Study[J]. Int J Mol Sci, 2019, 20 (17): 4273.

doi: 10.3390/ijms20174273
21
Sun D , Zhang T , Su S , et al. Body mass index drives changes in DNA methylation: A longitudinal study[J]. Circ Res, 2019, 125 (9): 824- 833.

doi: 10.1161/CIRCRESAHA.119.315397
22
Etzel L , Hastings WJ , Hall MA , et al. Obesity and accelerated epigenetic aging in a high-risk cohort of children[J]. Sci Rep, 2022, 12 (1): 8328.

doi: 10.1038/s41598-022-11562-5
23
Li J , Wang W , Yang Z , et al. Causal association of obesity with epigenetic aging and telomere length: A bidirectional mendelian randomization study[J]. Lipids Health Dis, 2024, 23 (1): 78.

doi: 10.1186/s12944-024-02042-y
24
Lundgren S , Kuitunen S , Pietiläinen KH , et al. BMI is positively associated with accelerated epigenetic aging in twin pairs discor-dant for body mass index[J]. J Intern Med, 2022, 292 (4): 627- 640.

doi: 10.1111/joim.13528
25
Föhr T , Hendrix A , Kankaanpää A , et al. Metabolic syndrome and epigenetic aging: A twin study[J]. Int J Obes (Lond), 2024, 48 (6): 778- 787.

doi: 10.1038/s41366-024-01466-x
26
Tzanetakou IP , Katsilambros NL , Benetos A , et al. 'Is obesity linked to aging?': Adipose tissue and the role of telomeres[J]. Ageing Res Rev, 2012, 11 (2): 220- 229.

doi: 10.1016/j.arr.2011.12.003
27
Tam BT , Morais JA , Santosa S . Obesity and ageing: Two sides of the same coin[J]. Obes Rev, 2020, 21 (4): e12991.

doi: 10.1111/obr.12991
28
Pérez LM , Pareja-Galeano H , Sanchis-Gomar F , et al. 'Adipa-ging': Ageing and obesity share biological hallmarks related to a dysfunctional adipose tissue[J]. J Physiol, 2016, 594 (12): 3187- 3207.

doi: 10.1113/JP271691
29
Reyes-Farias M , Fos-Domenech J , Serra D , et al. White adipose tissue dysfunction in obesity and aging[J]. Biochem Pharmacol, 2021, 192, 114723.

doi: 10.1016/j.bcp.2021.114723
[1] Zeyuan WANG, Shuanbao YU, Haoke ZHENG, Jin TAO, Yafeng FAN, Xuepei ZHANG. A preoperative prediction model for pelvic lymph node metastasis in prostate cancer: Integrating clinical characteristics and multiparametric MRI [J]. Journal of Peking University (Health Sciences), 2025, 57(4): 684-691.
[2] Yihang ZHANG, Shan CAI, Ziyue CHEN, Yunfei LIU, Jiajia DANG, Di SHI, Jiaxin LI, Tianyu HUANG, Yi SONG. Establishment of outcome indicators for the implementation of comprehensive intervention for multimorbidity of myopia and obesity among children and adolescents based on the RE-AIM framework [J]. Journal of Peking University (Health Sciences), 2025, 57(3): 436-441.
[3] Ping LI, Haixue WANG, Xiao GAO, Yajing HAN, Hui WANG, Haijun WANG, Yingying MU. A randomized controlled trial of weight management based on mobile health techno-logy among overweight or obese pregnant women [J]. Journal of Peking University (Health Sciences), 2025, 57(3): 465-472.
[4] Jianjun SUN, Qianquan MA, Xiaoliang YIN, Chenlong YANG, Jia ZHANG, Suhua CHEN, Chao WU, Jingcheng XIE, Yunfeng HAN, Guozhong LIN, Yu SI, Jun YANG, Haibo WU, Qiang ZHAO. Significance of precise classification of sacral meningeal cysts by multiple dimensions radiographic reconstruction MRI in guiding operative strategy and rehabilitation [J]. Journal of Peking University (Health Sciences), 2025, 57(2): 303-308.
[5] Yujia ZHU, Hua SHEN, Aonan WEN, Zixiang GAO, Qingzhao QIN, Shenyao SHAN, Wenbo LI, Xiangling FU, Yijiao ZHAO, Yong WANG. Deep learning algorithms for intelligent construction of a three-dimensional maxillofacial symmetry reference plane [J]. Journal of Peking University (Health Sciences), 2025, 57(1): 113-120.
[6] Huili LIU, Bei WEN, Xue BAI, Ming'an CHEN, Min LI. Association between weight-adjusted waist index and pain: A cross-sectional study [J]. Journal of Peking University (Health Sciences), 2025, 57(1): 178-184.
[7] Wenxin CAI, Qiongying YANG, Dan HAN, Zhe CHEN, Yongjing CHENG. Application and prospects of infrared thermography in rheumatic diseases [J]. Journal of Peking University (Health Sciences), 2024, 56(6): 1132-1136.
[8] Yuxuan TIAN,Mingjian RUAN,Yi LIU,Derun LI,Jingyun WU,Qi SHEN,Yu FAN,Jie JIN. Predictive effect of the dual-parametric MRI modified maximum diameter of the lesions with PI-RADS 4 and 5 on the clinically significant prostate cancer [J]. Journal of Peking University (Health Sciences), 2024, 56(4): 567-574.
[9] Jing CHEN,Rui SHAN,Wucai XIAO,Xiaorui ZHANG,Zheng LIU. Association between self-control and co-occurrence of depressive symptoms and overweight or obesity during adolescence and early adulthood: A ten-year prospective cohort study based on national surveys [J]. Journal of Peking University (Health Sciences), 2024, 56(3): 397-402.
[10] Xiaotong LING,Liuyang QU,Danni ZHENG,Jing YANG,Xuebing YAN,Denggao LIU,Yan GAO. Three-dimensional radiographic features of calcifying odontogenic cyst and calcifying epithelial odontogenic tumor [J]. Journal of Peking University (Health Sciences), 2024, 56(1): 131-137.
[11] Chu-yun CHEN,Peng-fei SUN,Jing ZHAO,Jia JIA,Fang-fang FAN,Chun-yan WANG,Jian-ping LI,Yi-meng JIANG,Yong HUO,Yan ZHANG. Related factors of endogenous erythropoietin and its association with 10-year risks of cardiovascular disease in a community-based Chinese study [J]. Journal of Peking University (Health Sciences), 2023, 55(6): 1068-1073.
[12] Yi LIU,Chang-wei YUAN,Jing-yun WU,Qi SHEN,Jiang-xi XIAO,Zheng ZHAO,Xiao-ying WANG,Xue-song LI,Zhi-song HE,Li-qun ZHOU. Diagnostic efficacy of prostate cancer using targeted biopsy with 6-core systematic biopsy for patients with PI-RADS 5 [J]. Journal of Peking University (Health Sciences), 2023, 55(5): 812-817.
[13] Chang-wei YUAN,De-run LI,Zhi-hua LI,Yi LIU,Gang-zhi SHAN,Xue-song LI,Li-qun ZHOU. Application of dynamic contrast enhanced status in multiparametric magnetic resonance imaging for prostatic cancer with PI-RADS 4 lesion [J]. Journal of Peking University (Health Sciences), 2023, 55(5): 838-842.
[14] Zhan-yi ZHANG,Fan ZHANG,Ye YAN,Cai-guang CAO,Chang-jian LI,Shao-hui DENG,Yue-hao SUN,Tian-liang HUANG,Yun-he GUAN,Nan LI,Min LU,Zhen-hua HU,Shu-dong ZHANG. Near-infrared targeted probe designed for intraoperative imaging of prostatic neurovascular bundles [J]. Journal of Peking University (Health Sciences), 2023, 55(5): 843-850.
[15] Zhuo-hua LIN,Ru-yi CAI,Yang SUN,Rong MU,Li-gang CUI. Methodology and clinical use of superb microvascular imaging in assessing micro-circulation changes of fingertips in systemic sclerosis [J]. Journal of Peking University (Health Sciences), 2023, 55(4): 636-640.
Viewed
Full text


Abstract

Cited

  Shared   
  Discussed   
No Suggested Reading articles found!