
1 资料与方法
1.1 研究对象
1.2 主要结局指标及协变量
1.3 社会同质性因素与结婚时间
1.4 基因分型及多态性位点检测信息
1.5 统计学分析
2 结果
2.1 研究对象基线特征
表1 研究对象基本特征(按性别区分)Table 1 Baseline characteristics of participants by sex |
| Items | All (n=684) | Male (n=342) | Female (n=342) | P |
| Age/years, ${\bar x}$±s | 64.91±8.76 | 65.67±9.32 | 64.15±8.10 | 0.025 |
| BMI/(kg/m2), ${\bar x}$±s | 25.145±3.632 | 24.512±3.345 | 25.778±3.799 | < 0.001 |
| TC/(mmol/L), ${\bar x}$±s | 3.652±1.179 | 3.562±1.105 | 3.741±1.244 | 0.047 |
| TG/(mmol/L), ${\bar x}$±s | 1.663±1.131 | 1.527±1.017 | 1.799±1.221 | 0.002 |
| LDL-C/(mmol/L), ${\bar x}$±s | 2.696±0.836 | 2.599±0.821 | 2.794±0.841 | 0.002 |
| HDL-C/(mmol/L), ${\bar x}$±s | 1.211±2.970 | 1.089±0.370 | 1.333±4.183 | 0.282 |
| Hypertension, n (%) | 478 (74.687) | 243 (75.938) | 235 (73.438) | 0.520 |
| Type 2 diabetes, n (%) | 158 (24.765) | 76 (23.824) | 82 (25.705) | 0.650 |
| Hyperlipidemia, n (%) | 226 (41.016) | 109 (38.380) | 117 (43.820) | 0.230 |
| Smoke status, n (%) | < 0.001 | |||
| Never | 368 (54.357) | 91 (26.844) | 277 (81.953) | |
| Current or former | 309 (45.643) | 248 (73.156) | 61 (18.047) | |
| Drinking status, n (%) | < 0.001 | |||
| Never | 499 (73.817) | 174 (51.479) | 325 (96.154) | |
| Current or former | 177 (26.183) | 164 (48.521) | 13 (3.846) | |
| Education, n (%) | < 0.001 | |||
| Below primary school | 153 (22.600) | 53 (15.680) | 100 (29.499) | |
| Primary school | 239 (35.303) | 104 (30.769) | 135 (39.823) | |
| Junior high school | 228 (33.678) | 141 (41.716) | 87 (25.664) | |
| High school | 53 (7.829) | 37 (10.947) | 16 (4.720) | |
| Junior college or above | 4 (0.591) | 3 (0.888) | 1 (0.295) |
BMI, body mass index; TC, total cholesterol; TG, triglycerides; LDL-C, low-density lipoprotein cholesterol; HDL-C, high-density lipoprotein cholesterol. |
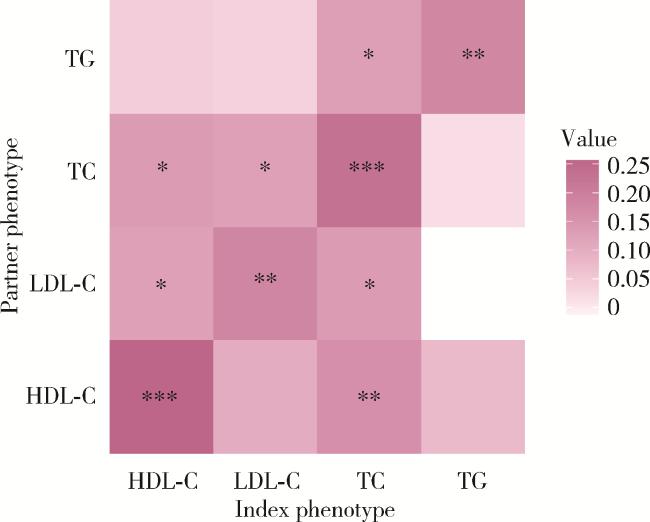
2.2 配偶间血脂指标的表型相关性
图2 配偶间血脂指标的表型相关性Figure 2 Correlation of lipid phenotypes between spouses * P < 0.05, * * P < 0.01, * * * P < 0.001. TC, total cholesterol; TG, triglycerides; LDL-C, low-density lipoprotein cholesterol; HDL-C, high-density lipoprotein cholesterol; Index phenotype, phenotype of an individual; Partner phenotype, phenotype of index ' s partner. |
表2 配偶间表型关联分析结果Table 2 Results of phenotype association analysis between spouses |
| Items | All (n=684) | Fangshan (n=574) | Fujian (n=110) | |||||
| r (95%CI) | P | r (95%CI) | P | r (95%CI) | P | |||
| TC | 0.183 (0.101, 0.265) | < 0.001 | 0.182 (0.090, 0.274) | < 0.001 | 0.186 (-0.002, 0.374) | 0.007 | ||
| TG | 0.203 (0.121, 0.285) | < 0.001 | 0.191 (0.099, 0.283) | < 0.001 | 0.259 (0.073, 0.445) | 0.672 | ||
| HDL-C | 0.241 (0.159, 0.323) | < 0.001 | 0.189 (0.095, 0.283) | < 0.001 | 0.421 (0.247, 0.595) | 0.055 | ||
| LDL-C | 0.168 (0.088, 0.248) | < 0.001 | 0.209 (0.119, 0.299) | < 0.001 | -0.015 (-0.207, 0.177) | < 0.001 | ||
Abbreviations as in Table 1. |
2.3 伴侣间趋同
表3 结婚时间与表型差值的相关性Table 3 Correlation of length of relationship and phenotype difference between spouses |
| Items | All (n=684) | Male≥Female* | Female≥Male# | |||||||
| r (95%CI) | P | n | r (95%CI) | P | n | r (95%CI) | P | |||
| ΔTG | 0.021 (-0.088, 0.129) | 0.706 | 170 | 0.016 (-0.138, 0.170) | 0.836 | 179 | 0.063 (-0.089, 0.212) | 0.419 | ||
| ΔTC | 0.086 (-0.023, 0.193) | 0.121 | 139 | 0.056 (-0.114, 0.224) | 0.519 | 209 | 0.134 (-0.005, 0.268) | 0.058 | ||
| ΔHDL-C | 0.095 (-0.014, 0.202) | 0.086 | 139 | 0.070 (-0.101, 0.238) | 0.422 | 209 | 0.125 (-0.014, 0.260) | 0.079 | ||
| ΔLDL-C | 0.043 (-0.066, 0.151) | 0.443 | 171 | -0.036 (-0.190, 0.120) | 0.653 | 181 | 0.121 (-0.027, 0.264) | 0.109 | ||
* Male phenotype is greater than female phenotype in spouses; # Female phenotype is greater than male phenotype in spouses. Abbreviations as in Table 1. |
表4 结婚时间与表型差值的广义线性模型关联分析Table 4 Generalized linear model association analysis between length of relationship and phenotype difference |
| Items | All (n=684) | Male≥Female* | Female≥Male# | |||||||
| β (95%CI) | P | n | β (95%CI) | P | n | β (95%CI) | P | |||
| ΔTG | -0.008 (-0.030, 0.014) | 0.461 | 170 | -0.010 (-0.045, 0.025) | 0.590 | 179 | -0.012 (-0.039, 0.015) | 0.393 | ||
| ΔTC | 0.021 (-0.001, 0.043) | 0.048 | 139 | 0.021 (-0.012, 0.054) | 0.232 | 209 | 0.023 (-0.004, 0.050) | 0.112 | ||
| ΔHDL-C | 0.013 (-0.007, 0.033) | 0.181 | 139 | 0.015 (-0.010, 0.040) | 0.260 | 209 | 0.017 (-0.012, 0.046) | 0.251 | ||
| ΔLDL-C | 0.025 (0.003, 0.047) | 0.025 | 171 | 0.043 (0.008, 0.078) | 0.022 | 181 | 0.014 (-0.013, 0.041) | 0.323 | ||
* Male phenotype is greater than female phenotype in spouses; # Female phenotype is greater than male phenotype in spouses. Abbreviations as in Table 1. |
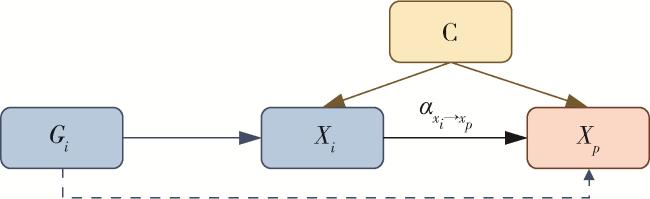
2.4 选择性婚配
表5 配偶间特异性孟德尔随机化分析结果Table 5 Results of couple-specific Mendelian randomization |
| Items | Male to female (n=123) | Female to male (n=123) | All (n=246) | |||||
| α(95%CI) | P | α(95%CI) | P | α(95%CI) | P | |||
| TG | -0.684 (-1.757, 0.388) | 0.211 | -0.498 (-1.592, 0.596) | 0.373 | -0.578 (-1.297, 0.141) | 0.115 | ||
| TC | 0.626 (-1.476, 2.728) | 0.559 | 1.681 (-0.228, 3.589) | 0.084 | 1.146 (-0.388, 2.681) | 0.143 | ||
| HDL-C | -0.206 (-1.128, 0.716) | 0.662 | 0.337 (-0.500, 1.174) | 0.430 | 0.087 (-0.539, 0.713) | 0.785 | ||
| LDL-C | 0.592 (-0.316, 1.500) | 0.202 | -0.294 (-1.460, 0.873) | 0.622 | 0.021 (-0.760, 0.802) | 0.958 | ||
Abbreviations as in Table 1. |