
1 资料与方法
1.1 研究对象
1.2 肥胖相关指标定义
1.3 DNA甲基化时钟指标计算
1.4 卵型鉴定
1.5 统计学分析
2 结果
2.1 基本特征
表1 研究人群基本特征Table 1 The characteristics of study participants |
| Characteristics | Overall samples (n=1 070) | Baseline (n=314) | Follow-up (n=314) | P value | |
| Demographic characteristics | |||||
| Chronological age/years, ${\bar x}$±s | 49.9±12.2 | 50.4±10.2 | 55.0±10.1 | < 0.001 | |
| Gender, n(%) | |||||
| Male | 728 (68.0) | 191 (60.8) | |||
| Female | 342 (32.0) | 123 (39.2) | |||
| Zygosity, n(%) | |||||
| MZ | 760 (71.0) | 190 (60.5) | |||
| DZ | 310 (29.0) | 124 (39.5) | |||
| Smoking status, n(%) | 0.450 | ||||
| Never smoked | 585 (54.7) | 190 (60.5) | 188 (59.9) | ||
| Former smoker | 138 (12.9) | 26 (8.3) | 35 (11.1) | ||
| Current smoker | 347 (32.4) | 98 (31.2) | 91 (29.0) | ||
| Alcohol consumption, n(%) | < 0.001 | ||||
| Never drank | 549 (51.3) | 148 (47.1) | 89 (28.3) | ||
| Former drinker | 71 (6.6) | 10 (3.2) | 139 (44.3) | ||
| Current drinker | 450 (42.1) | 156 (49.7) | 86 (27.4) | ||
| Physical activity level, n(%) | < 0.001 | ||||
| High | 519 (48.5) | 43 (13.7) | 117 (37.3) | ||
| Moderate | 186 (17.4) | 79 (25.2) | 69 (22.0) | ||
| Low | 365 (34.1) | 192 (61.1) | 128 (40.8) | ||
| Obesity indicators | |||||
| Weight/kg, ${\bar x}$±s | 65.0±12.1 | 62.3±11.6 | 62.4±11.4 | 0.899 | |
| BMI/(kg/m2), ${\bar x}$±s | 24.8±3.7 | 24.3±3.5 | 24.3±3.5 | 0.782 | |
| Waist circumference/cm, ${\bar x}$±s | 87.0±10.1 | 85.4±9.7 | 86.2±9.4 | 0.292 | |
| Waist-hip ratio, ${\bar x}$±s | 0.9 ±0.1 | 0.9±0.1 | 0.9±0.1 | 0.001 | |
| Waist-height ratio, ${\bar x}$±s | 0.5±0.1 | 0.5±0.1 | 0.5±0.1 | 0.260 | |
| BMI classification, n(%) | 0.962 | ||||
| Underweight | 35 (3.3) | 14 (4.5) | 16 (5.1) | ||
| Normal | 539 (50.9) | 168 (54.4) | 165 (52.9) | ||
| Overweight | 404 (38.2) | 112 (36.2) | 117 (37.5) | ||
| Obese | 80 (7.6) | 15 (4.9) | 14 (4.5) | ||
| Central obesity, n(%) | 1.000 | ||||
| Yes | 485 (45.5) | 124 (39.5) | 123 (39.2) | ||
| No | 582 (54.5) | 190 (60.5) | 191 (60.8) | ||
| DNAm clock | |||||
| GrimAA/years, ${\bar x}$±s | 0.00±3.86 | 0.02±4.10 | 0.04±3.73 | 0.941 | |
| DunedinPACE, ${\bar x}$±s | 1.13±0.11 | 1.13±0.10 | 1.14±0.11 | 0.232 | |
| PCGrimAA/years, ${\bar x}$±s | 0.00±2.62 | -0.15±2.71 | 0.15±2.71 | 0.175 |
Physical activity level was derived from self-reported frequency and duration of work, transport, domestic, and leisure-time activities, and categorized into low, moderate, and high according to the International Physical Activity Questionnaire (IPAQ) scoring protocol. BMI classification: Underweight is defined as BMI < 18.5 kg/m2, normal weight as 18.5 kg/m2 ≤BMI < 24.0 kg/m2, overweight as 24.0 kg/m2≤BMI < 28.0 kg/m2, and obesity as BMI≥28.0 kg/m2. MZ, monozygotic twins; DZ, dizygotic twins; BMI, body mass index; DNAm, DNA methylation;GrimAA, GrimAge acceleration; PCGrimAA, principle component GrimAA. |
2.2 肥胖与DNA甲基化时钟指标的横断面相关性
表2 肥胖相关指标与GrimAA及PCGrimAA的横断面相关性Table 2 Cross-sectional associations between obesity indicators and GrimAA or PCGrimAA |
| Characteristics | GrimAA (Model 1) | GrimAA (Model 2) | PCGrimAA (Model 3) | |||||
| β(95%CI) | PFDR | β(95%CI) | PFDR | β(95%CI) | PFDR | |||
| Weight | -0.03 (-0.05, -0.01) | 0.005 | -0.03 (-0.05, -0.01) | 0.006 | -0.02 (-0.03, -0.00) | 0.043 | ||
| BMI | -0.09 (-0.14, -0.03) | 0.007 | -0.07 (-0.12, -0.02) | 0.024 | -0.03 (-0.06, 0.01) | 0.273 | ||
| Waist circumference | -0.02 (-0.04, 0.00) | 0.071 | -0.02 (-0.04, 0.00) | 0.077 | -0.01 (-0.02, 0.01) | 0.512 | ||
| Waist-hip ratio | -0.87 (-3.93, 2.19) | 0.577 | -0.79 (-3.69, 2.11) | 0.595 | 0.28 (-1.66, 2.22) | 0.820 | ||
| Waist-height ratio | -2.69 (-5.91, 0.53) | 0.119 | -2.20 (-5.26, 0.85) | 0.183 | -0.24 (-2.28, 1.81) | 0.820 | ||
| Obesity | -0.75 (-1.27, -0.24) | 0.009 | -0.58 (-1.07, -0.10) | 0.044 | -0.23 (-0.55, 0.09) | 0.273 | ||
| Central obesity | -0.60 (-1.18, -0.03) | 0.068 | -0.56 (-1.11, -0.01) | 0.077 | -0.28 (-0.64, 0.08) | 0.273 | ||
Model 1, adjusted for age and sex; Model 2, further adjusted for smo-king, alcohol consumption, and physical activity; Model 3, based on Model 2, with GrimAA replaced by PCGrimAA. BMI, body mass index; GrimAA, GrimAge acceleration; PCGrimAA, principle component GrimAA; β, regression coefficient; CI, confidence interval; FDR, false discovery rate. |
表3 肥胖相关指标与DunedinPACE的横断面相关性Table 3 Cross-sectional associations between obesity indicators and DunedinPACE |
| Characteristic | Model 1 | Model 2 | |||
| β(95%CI) | PFDR | β(95%CI) | PFDR | ||
| Weight | 0.000 7 (0.000 1, 0.001 3) | 0.028 | 0.000 7 (0.000 1, 0.001 3) | 0.026 | |
| BMI | 0.003 0 (0.001 4, 0.004 7) | < 0.001 | 0.003 2 (0.001 5, 0.004 8) | < 0.001 | |
| Waist circumference | 0.001 1 (0.000 5, 0.001 7) | < 0.001 | 0.001 1 (0.000 5, 0.001 7) | 0.001 | |
| Waist-hip ratio | 0.168 8 (0.073 9, 0.263 7) | < 0.001 | 0.162 4 (0.068 0, 0.256 9) | 0.001 | |
| Waist-height ratio | 0.208 2 (0.108 4, 0.307 9) | < 0.001 | 0.208 7 (0.109 5, 0.307 9) | < 0.001 | |
| Obesity | 0.033 4 (0.017 9, 0.048 9) | < 0.001 | 0.035 8 (0.020 5, 0.051 0) | < 0.001 | |
| Central obesity | 0.024 8 (0.006 9, 0.042 7) | 0.008 | 0.026 4 (0.008 8, 0.044 0) | 0.004 | |
Model 1, adjusted for age and sex; Model 2, further adjusted for smoking, alcohol consumption, and physical activity. BMI, body mass index; β, regression coefficient; CI, confidence interval; FDR, false discovery rate. |
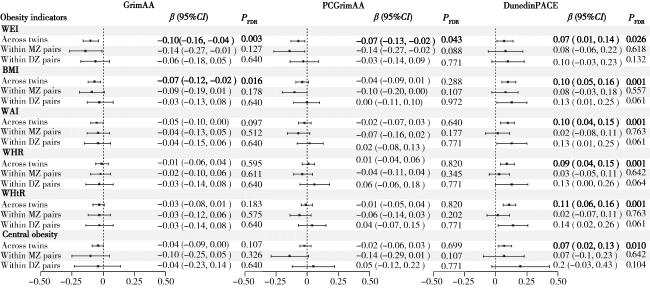
图1 全部双生子与对内分析中GrimAA、PCGrimAA和DunedinPACE与肥胖相关指标的横断面相关性Figure 1 Cross-sectional correlation between GrimAA, PCGrimAA, DunedinPACE and obesity indicators in all twins and within-pair analysis WEI, weight; BMI, body mass index; WAI, waist circumference; WHR, waist-hip ratio; WHtR, waist-height ratio; MZ, monozygotic twins; DZ, dizygotic twins; GrimAA, GrimAge acceleration; PCGrimAA, principle component GrimAA; β, regression coefficient; CI, confidence interval; FDR, false discovery rate. |
2.3 肥胖与DNA甲基化时钟指标的纵向时序关系
表4 双生子肥胖相关指标与DNA甲基化时钟指标交叉滞后关联Table 4 Cross-lagged relationships between obesity indicators and DNAm clock metrics |
| Characteristics | Obesity indicators at baseline → DNAm clock metrics at follow-up | DNAm clock metrics at baseline → Obesity indicators at follow-up | Fit statistics | |||||
| ρ1 | PFDR | ρ2 | PFDR | SRMR | CFI | |||
| GrimAA | ||||||||
| Weight | 0.04 | 0.035 | 0.02 | 0.996 | 0.04 | 0.96 | ||
| BMI | 0.05 | 0.414 | 0.01 | 0.996 | 0.05 | 0.94 | ||
| Waist circumference | 0.03 | 0.250 | 0.01 | 0.996 | 0.05 | 0.92 | ||
| Waist-hip ratio | 2.46 | 0.414 | 0.00 | 0.996 | 0.05 | 0.88 | ||
| Waist-height ratio | 0.08 | 0.974 | 0.00 | 0.996 | 0.05 | 0.92 | ||
| PCGrimAA | ||||||||
| Weight | 0.03 | < 0.001 | 0.00 | 0.966 | 0.01 | 1.00 | ||
| BMI | 0.07 | 0.022 | 0.01 | 0.966 | 0.02 | 0.99 | ||
| Waist circumference | 0.02 | 0.040 | 0.02 | 0.966 | 0.02 | 0.98 | ||
| Waist-hip ratio | 0.95 | 0.542 | 0.00 | 0.966 | 0.03 | 0.97 | ||
| Waist-height ratio | 1.99 | 0.226 | 0.00 | 0.966 | 0.02 | 0.99 | ||
| DunedinPACE | ||||||||
| Weight | 0.00 | 0.310 | -1.06 | 0.999 | 0.02 | 1.00 | ||
| BMI | 0.00 | 0.310 | 0.14 | 0.999 | 0.02 | 1.00 | ||
| Waist circumference | 0.00 | 0.088 | 0.01 | 0.999 | 0.02 | 0.99 | ||
| Waist-hip ratio | 0.17 | 0.030 | 0.02 | 0.999 | 0.03 | 0.98 | ||
| Waist-height ratio | 0.12 | 0.088 | 0.01 | 0.999 | 0.02 | 1.00 | ||
DNAm, DNA methylation; GrimAA, GrimAge acceleration; PCGrimAA, principle component GrimAA; BMI, body mass index;FDR, false disco-very rate; SRMR, standard root mean square residual; CFI, compare fitting indices. |