
1 材料与方法
1.1 实验动物
1.2 实验仪器和核素示踪剂
1.3 SPECT/CT成像方法
1.4 生物体内分布实验
1.5 数据处理和统计学分析
2 结果
2.1 99mTc-DTPA经脑ECS给药后SPECT/CT的成像特点
2.1.1 尾状核区存在“对侧小脑优势引流”
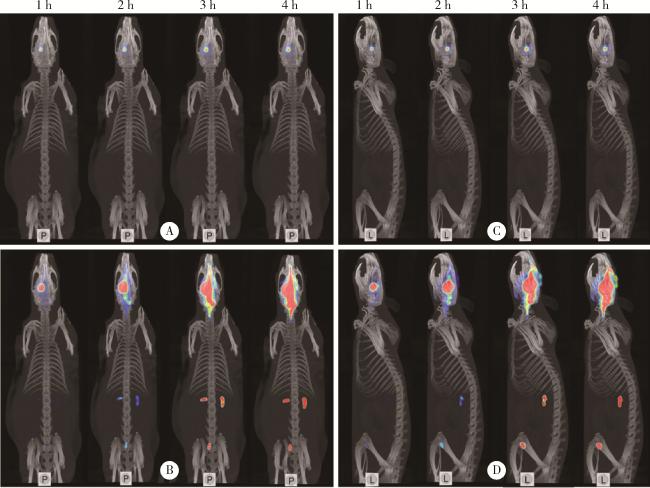
图1 正常SD大鼠左侧尾状核注射99mTc-DTPA的SPECT/CT图像Figure 1 SPECT/CT images of 99mTc-DTPA injected into the left caudate nucleus of normal SD rats A and C, original drawings; B and D, enlarged view of signal. P, horizontal axis; L, left sagittal; SPECT/CT, single photon emission computed tomography/computed tomography. |
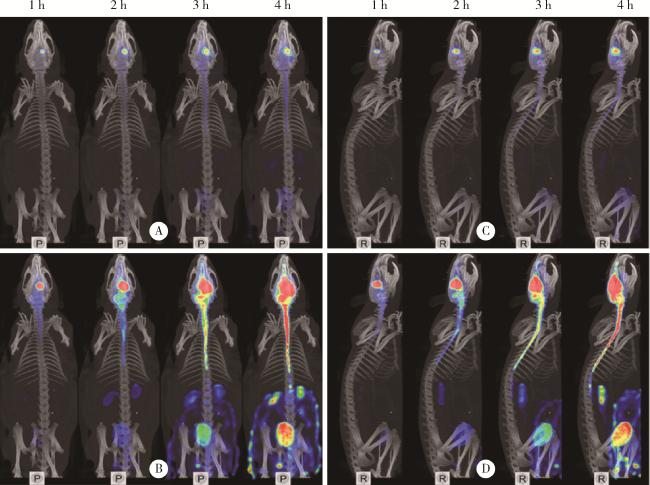
图2 正常SD大鼠右侧尾状核注射99mTc-DTPA的SPECT/CT图像Figure 2 SPECT/CT images of 99mTc-DTPA injected into the right caudate nucleus of normal SD rats A and C, original drawings; B and D, enlarged view of signal. P, horizontal axis; R, right sagittal; SPECT/CT, single photon emission computed tomography/computed tomography. |
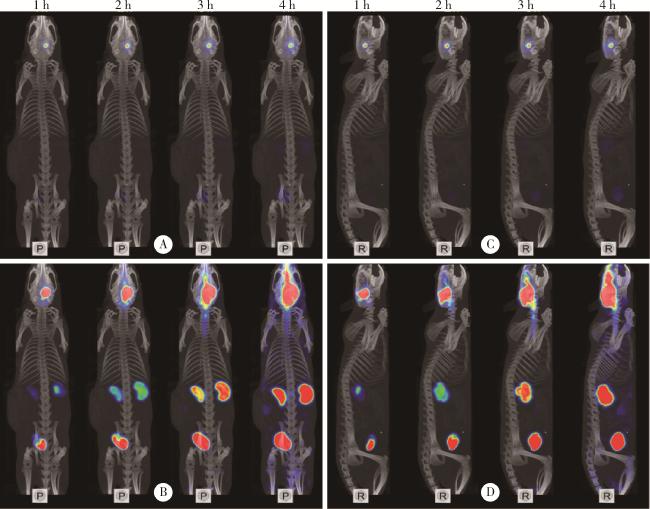
2.1.2 丘脑区存在“同侧小脑优势引流”
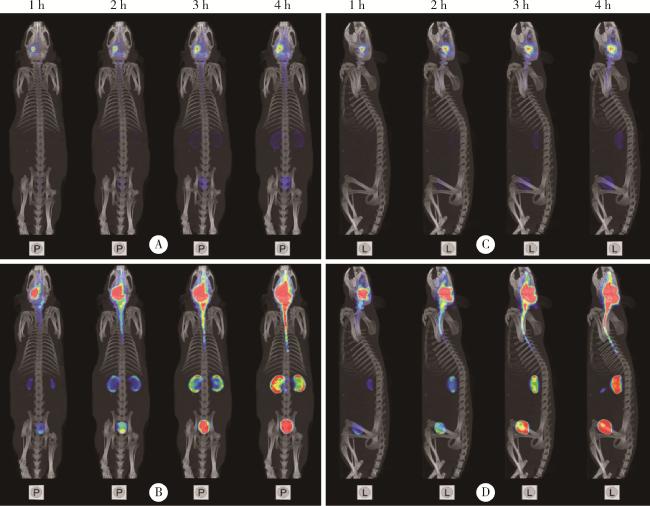
图3 正常SD大鼠左侧丘脑区注射 99mTc-DTPA的SPECT/CT图像Figure 3 SPECT/CT images of 99mTc-DTPA injected into the left thalamus of normal SD rats A and C, original drawings; B and D, enlarged view of signal. P, horizontal axis; L, left sagittal; SPECT/CT, single photon emission computed tomography/computed tomography. |
图4 正常SD大鼠右侧丘脑注射 99mTc-DTPA的SPECT/CT图像Figure 4 SPECT/CT images of 99mTc-DTPA injected into the right thalamus of normal SD rats A and C, original drawings; B and D, enlarged view of signal. P, horizontal axis; R, right sagittal; SPECT/CT, single photon emission computed tomography/computed tomography. |
2.2 99mTc-DTPA经脑ECS给药后在大鼠体内的生物分布
表1 正常SD大鼠分别在右侧尾状核和右侧丘脑注入99mTc-DTPA 4 h后的体内分布(n=5)Table 1 In vivo distribution of 99mTc-DTPA 4 h after injection into the right caudate nucleus and the right thalamus of normal SD rats (n=5) |
| Organs and tissues | Radioactive uptake value/(%ID/g), $\bar x \pm s$ | |
| R-Cn | R-Tha | |
| Olfactory bulb | 45.66±13.48 | 31.73±6.45 |
| Cerebellum | 26.06±16.26 | 73.70±25.17 |
| Brain-R | 159.85±85.37 | 221.93±54.04 |
| Brain-L | 28.60±13.56 | 49.73±16.64 |
| Heart | 0.44±0.30 | 1.20±0.52 |
| Liver | 0.68±0.68 | 0.87±0.39 |
| Spleen | 0.21±0.08 | 0.87±0.47 |
| Lung-R | 0.84±0.40 | 2.42±0.94 |
| Lung-L | 0.60±0.34 | 2.15±0.87 |
| Kidney-R | 2.98±1.55 | 5.30±1.50 |
| Kidney-L | 2.74±1.25 | 5.61±1.56 |
| Blood | 2.49±0.88 | 4.83±1.83 |
| Urine | 102.32±25.61 | 312.55±48.10 |
R, right; L, left; Cn, caudate nucleus; Tha, thalamus; %ID/g, percentage activity of injection dose per gram of tissue. |