
1 资料与方法
1.1 调查对象
表1 受试者的学段和性别分布Table 1 Grade and gender distribution of children and adolescents |
| Items | Primary school | Junior school | High school | Total |
| Boys | 739 | 606 | 696 | 2 041 |
| Girls | 739 | 596 | 827 | 2 162 |
| Total | 1 478 | 1 202 | 1 523 | 4 203 |
1.2 研究方法
1.3 统计学分析
2 结果
2.1 视力不良与视力正常儿童青少年久坐行为的差异性比较
表2 儿童青少年久坐行为的描述性统计Table 2 Comparison of sedentary behaviour in children and adolescents |
| Group | Total | Study | Screen | Transportation | Leisure |
| Normal vision | 237.1±112.6 | 147.08±92.6 | 36.4±65.7 | 8.9±21.4 | 35.7±52.1 |
| Poor vision | 362.9±189.3 | 231.4±110.0 | 42.9±68.6 | 7.1±17.8 | 41.4±52.9 |
| Boys | 308.5±172.8 | 192.9±114.3 | 40.7±73.6 | 7.1±18.6 | 37.1±53.8 |
| Girls | 319.0±160.9 | 205.7±123.6 | 36.1±59.2 | 8.6±21.4 | 40.0±51.4 |
Data were $\bar x \pm s$. Total, total sedentary time;Study, study sedentary time; Screen,screen sedentary time; Transportation,transportation sedentary time; Leisure, leisure sedentary time. |
2.2 ROC曲线分析
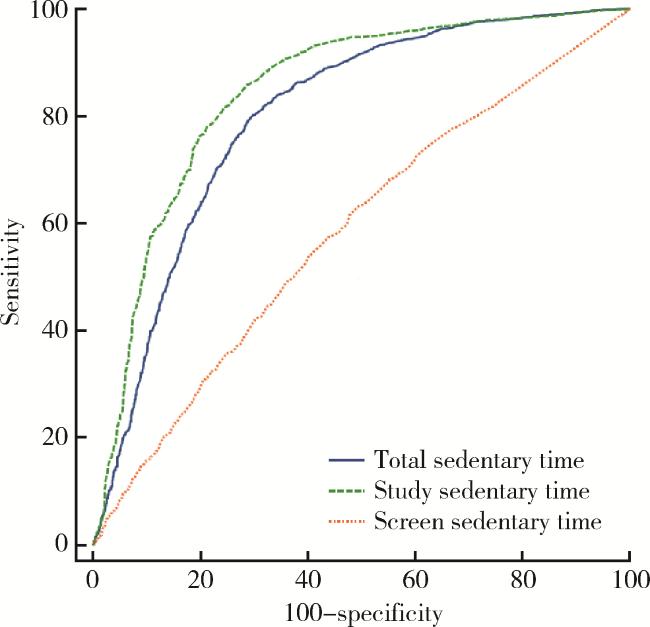
图1 儿童青少年久坐行为与视力情况的ROC曲线Figure 1 ROC Curve of sedentary behavior and vision conditions in children and adolescents |
表3 ROC曲线分析结果Table 3 Results of ROC curve analysis |
| Sedentary behavior | AUC | SE | P | 95%CI | SE | SP | Maximum Youden index | Sedentary time thresholds/min |
| Total | 0.792 | 0.008 | < 0.001 | 0.788-0.812 | 0.786 | 0.681 | 0.468 | 281.1 |
| Study | 0.824 | 0.007 | < 0.001 | 0.812-0.835 | 0.814 | 0.613 | 0.428 | 168.3 |
| Screen | 0.524 | 0.001 | < 0.05 | 0.506-0.542 | 0.666 | 0.386 | 0.052 | 21.6 |
Total, total sedentary time;Study, study sedentary time; Screen,screen sedentary time. AUC, area under the curve. |
表4 久坐时间与视力情况四格表Table 4 Sedentary time and visual conditions four-grid table |
| Sedentary time/min | Poor vision conditions, n(%) | n | χ2 | OR(95%CI) | ||
| Yes | No | |||||
| Total | < 281.1 | 559 (34.2) | 1 075 (65.8) | 1 634 | 902.485# | 1.128 (1.111-1.147) |
| ≥281.1 | 2 062 (80.3) | 507 (19.7) | 2 569 | |||
| Study | < 168.3 | 486 (33.4) | 971 (66.6) | 1 457 | 799.245# | 2.331 (2.162-2.513) |
| ≥168.3 | 2 135 (77.7) | 611 (22.3) | 2 746 | |||
| Screen | < 21.6 | 876 (58.9) | 609 (53.1) | 1 485 | 11.390# | 1.250 (1.098-1.424) |
| ≥21.6 | 1 745 (64.2) | 973 (35.8) | 2 718 | |||
Total, total sedentary time;Study, study sedentary time; Screen,screen sedentary time. # P < 0.001. |
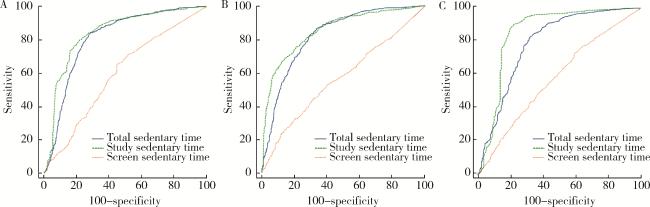
2.3 各学段学生久坐行为与视力的Logistic回归和ROC曲线分析
表5 各学段学生久坐行为与视力的Logistic回归分析Table 5 Logistic regression analysis of sedentary behavior and vision conditions in students of different grades |
| Grades | Sedentary time | β | SE | Wald | df | P | OR(95%CI) |
| Primary school | Total | 0.008 | 0.001 | 29.515 | 1 | 0.001 | 1.008(1.005-1.011) |
| Study | 0.005 | 0.002 | 8.638 | 1 | 0.003 | 1.005(1.002-1.009) | |
| Screen | 0.004 | 0.001 | 10.377 | 1 | 0.001 | 1.004(1.002-1.007) | |
| Junior school | Total | 0.001 | 0.001 | 0.542 | 1 | 0.462 | 1.000(0.999-1.002) |
| Study | 0.019 | 0.002 | 92.845 | 1 | 0.001 | 1.003(1.002-1.004) | |
| Screen | 0.001 | 0.001 | 1.27 | 1 | 0.26 | 1.001(0.998-1.002) | |
| High school | Total | 0.003 | 0.002 | 4.573 | 1 | 0.052 | 1.002(0.998-1.003) |
| Study | 0.009 | 0.002 | 20.726 | 1 | 0.001 | 1.009(1.005-1.012) | |
| Screen | 0.002 | 0.001 | 1.899 | 1 | 0.168 | 1.002(0.997-1.008) |
Total, total sedentary time;Study, study sedentary time; Screen,screen sedentary time. |
图2 各学段久坐时间与视力的ROC曲线Figure 2 ROC curves for sedentary time and vision conditions at different grades A, primary school; B, junior school; C, high school. |
表6 各学段久坐时间与视力情况四格表Table 6 Sedentary time thresholds and vision conditions at different grades |
| Grades | Sedentary time | Poor vision conditions, n(%) | Total | χ2 | OR(95%CI) | |
| Yes | No | |||||
| Primary school | < 192.9 | 162 (21.1) | 634 (78.9) | 796 | 350.926# | 2.693 (2.584-2.893) |
| ≥192.9 | 575 (85.4) | 107 (14.6) | 682 | |||
| Junior school | < 251 | 335 (45.0) | 410 (55.0) | 746 | 294.133# | 2.089 (1.923-2.269) |
| ≥251 | 429 (94.1) | 28 (5.9) | 456 | |||
| High school | < 154.3 | 135 (31.9) | 288 (68.1) | 423 | 518.986# | 2.803 (2.435-3.226) |
| ≥154.3 | 984 (89.5) | 116 (10.5) | 1 100 | |||
# P < 0.001. |