
1 资料与方法
1.1 研究对象
1.2 影像学指标
1.2.1 Haller指数
1.2.2 不对称指数
1.2.3 Cobb角
1.2.4 胸骨扭转角指数
1.3 统计学方法
2 结果
2.1 漏斗胸患者Nuss术前基本情况
表1 漏斗胸患者Nuss术前基本情况(n=59)Table 1 Baseline characteristics of pectus excavatum patients before Nuss procedure (n=59) |
| Characteristics | Values |
| Age/years, ${\bar x}$±s | 16.0±3.99 |
| Gender, n(%) | |
| Male | 52 (88.1) |
| Female | 7 (11.9) |
| Height/cm, ${\bar x}$±s | 134±8.71 |
| Weight/kg, ${\bar x}$±s | 38.3±8.15 |
| Body mass index/(kg/m2), ${\bar x}$±s | 20.0±2.36 |
| Mitral valve prolapse, n(%) | 3 (5.08) |
| Mitral regurgitation, n(%) | 6 (10.2) |
| Tricuspid regurgitation, n(%) | 1 (1.69) |
| Pulmonary artery hypertension, n(%) | 4 (6.78) |
2.2 漏斗胸患者Nuss术后随访数据
表2 漏斗胸患者Nuss手术前后影像学指标变化Table 2 Radiographic parameter changes before and 3 months after Nuss procedure in pectus excavatum patients |
| Radiographic parameters | Before Nuss | 3 months after Nuss | P |
| Haller index, median (P25, P75) | 3.20 (0.47, 5.35) | 1.32 (0.18, 2.53) | < 0.000 1 |
| Sternal torsion angle index, median (P25, P75) | 16.0 (5.75, 29.8) | 11.8 (1.78, 21.6) | < 0.000 1 |
| Asymmetry index, median (P25, P75) | 0.59 (0.33, 0.89) | 0.32 (0.12, 0.48) | < 0.000 1 |
| Cobb angel, ${\bar x}$±s | 7.16±2.45 | 8.86±3.20 | 0.001 6 |
2.3 Nuss术后脊柱侧弯的Cox比例风险回归分析
表3 漏斗胸患者Nuss术后合并脊柱侧弯的单因素Cox回归分析Table 3 Univariate Cox regression analysis of factors associated with scoliosis in pectus excavatum patients after the Nuss procedure |
| Variable | HR (95%CI) | β | SE | P |
| Age | 1.19 (1.05-1.36) | 0.18 | 0.07 | 0.010 |
| Gender | 0.00 (0.00-Infinity) | -18.20 | 6 900.00 | 1.000 |
| Height | 1.07 (1.01-1.14) | 0.07 | 0.03 | 0.040 |
| Weight | 1.10 (1.02-1.19) | 0.10 | 0.04 | 0.020 |
| BMI | 0.67 (0.49-0.90) | -0.40 | 0.15 | 0.010 |
| Mitral valve prolapse | 4.75 (0.54-41.64) | 1.56 | 1.11 | 0.160 |
| Mitral regurgitation | 1.54 (0.34-7.04) | 0.43 | 0.78 | 0.580 |
| Pulmonary artery hypertension | 17.08 (4.66-62.62) | 2.84 | 0.66 | < 0.001 |
| Haller index | 0.25 (0.14-0.43) | -1.40 | 0.29 | < 0.001 |
| STA index | 0.68 (0.58-0.80) | -0.39 | 0.08 | < 0.001 |
| Asymmetry index | 0.00 (0.00-0.00) | -19.70 | 4.30 | < 0.001 |
| Cobb angle | 0.41 (0.28-0.61) | -0.89 | 0.20 | < 0.001 |
HR, hazard ratio; CI, confidence interval; β, regression coefficient; SE, standard error; BMI, body mass index; STA, sternal torsion angle. |
表4 漏斗胸患者Nuss术后脊柱侧弯的多因素Cox回归分析Table 4 Multivariate Cox regression analysis of factors associated with scoliosis in pectus excavatum patients after the Nuss procedure |
| Variable | HR (95%CI) | β | SE | P |
| Age | 1.19 (0.96-1.48) | 0.176 | 0.110 | 0.111 |
| Height | 1.09 (0.94-1.25) | 0.083 | 0.073 | 0.259 |
| Weight | 1.04 (0.87-1.25) | 0.040 | 0.092 | 0.664 |
| BMI | 1.13 (0.61-2.08) | 0.119 | 0.313 | 0.704 |
| Pulmonary artery hypertension | 20.80 (1.37-314.00) | 3.030 | 1.390 | 0.029 |
| Haller index | 39.9 (0.19-8 380) | 3.690 | 2.730 | 0.177 |
| STA index | 0.47 (0.06-3.55) | -0.749 | 1.030 | 0.466 |
| Asymmetry index | 1.8×10-54 (3.6×10-96-9.1×10⁻¹³) | -124.000 | 49.000 | 0.011 |
| Cobb angle | 54.4 (0.31-9 650) | 4.000 | 2.640 | 0.131 |
Abbreviations as in Table 3. |
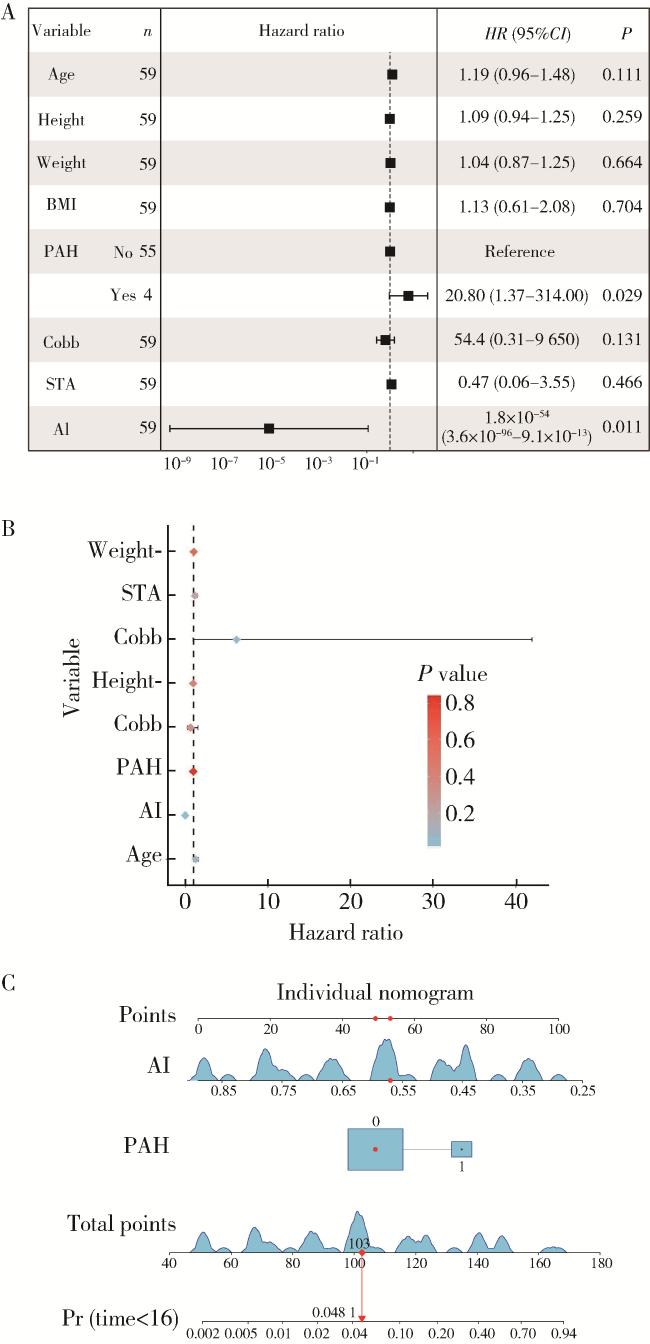
图1 漏斗胸Nuss术后合并脊柱侧弯患者风险预测模型的建立Figure 1 Establishment of a risk prediction model for scoliosis in pectus excavatum patients after the Nuss procedure A, B, forest plots showing the results of the multivariate Cox regression analysis, indicating that AI and PAH are key risk factors influencing postoperative scoliosis in patients; C, nomogram displaying the prediction model. BMI, body mass index; PAH, pulmonary arterial hypertension; STA, sternal torsion angle; AI, asymmetry index; Pr, prediction. |
2.4 Nuss术后发生脊柱侧弯的风险预测模型的建立及验证
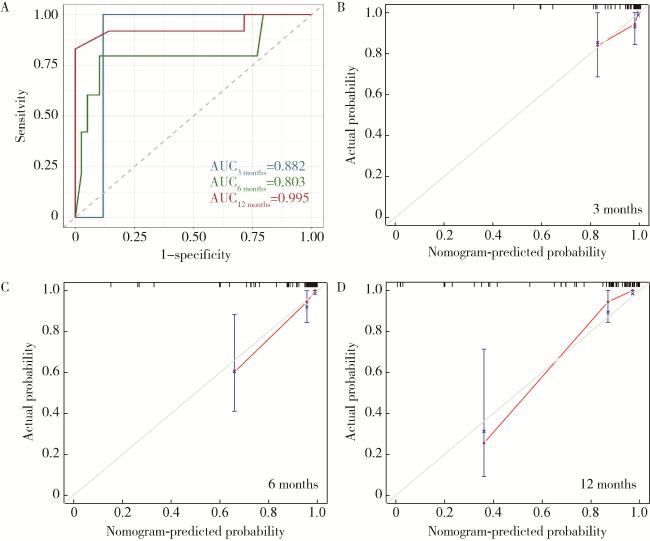
图2 漏斗胸Nuss术后合并脊柱侧弯患者风险预测模型的验证Figure 2 Validation of the risk prediction model for scoliosis in pectus excavatum patients after the Nuss procedure A, time-dependent receiver operating characteristic (ROC) curve at 3, 6, and 12 months evaluating the predictive performance of the overall prediction model on patient prognosis; B-D, calibration curves at 3, 6, and 12 months assessing the consistency between predicted and actual values respectively. AUC, area under the curve. |