
1 资料与方法
1.1 临床资料
1.2 随访
1.3 统计学分析
2 结果
2.1 基本资料
表1 两组患者匹配的变量对比Table 1 Comparison of matching variables between the two groups of patients |
| Items | RC alone (n=34) | RCNU (n=34) | All patients (n=68) | P value |
| Ages at surgery/years, ${\bar x}$±s | 69.21±9.41 | 69.94±9.30 | 69.57±9.29 | 0.657 |
| Gender, n (%) | >0.999 | |||
| Female | 11 (32.4) | 11 (32.4) | 22 (32.4) | |
| Male | 23 (67.6) | 23 (67.6) | 46 (67.6) | |
| BMI/(kg/m2), ${\bar x}$±s | 23.86±2.56 | 23.41±3.84 | 23.64±3.25 | 0.518 |
| CCI, n (%) | 0.624 | |||
| < 2 | 16 (47.1) | 13 (38.2) | 29 (42.7) | |
| ≥2 | 18 (52.9) | 21 (61.8) | 39 (57.3) | |
| pT stage, n (%) | 0.401 | |||
| < pT2 | 10 (29.4) | 7 (20.6) | 17 (25.0) | |
| ≥pT2 | 24 (70.6) | 27 (79.4) | 51 (75.0) | |
| pN stage, n (%) | 0.525 | |||
| N0/X | 27 (79.4) | 29 (85.3) | 56 (82.4) | |
| N1 | 7 (20.6) | 5 (14.7) | 12 (17.6) | |
| Tumor grade, n (%) | 0.317 | |||
| G1 | 1 (2.9) | 0 (0) | 1 (1.5) | |
| G2 | 1 (2.9) | 1 (2.9) | 2 (2.9) | |
| G3 | 32 (94.2) | 33 (97.1) | 65 (95.6) | |
| ASA score, n (%) | 0.287 | |||
| <3 | 27 (87.1) | 23 (67.6) | 50 (76.9) | |
| ≥3 | 4 (12.9) | 11 (32.4) | 15 (23.1) | |
| TURBT history, n (%) | >0.999 | |||
| No | 11 (32.4) | 11 (32.4) | 22 (32.4) | |
| Yes | 23 (67.6) | 23 (67.6) | 46 (67.6) | |
| Fundamental disease, n (%) | 0.805 | |||
| HBP | 18 (52.9) | 16 (47.1) | 34 (50) | 0.634 |
| DM | 7 (20.6) | 6 (17.6) | 13 (19.1) | 0.763 |
| Coronary heart disease | 6 (17.6) | 5 (14.7) | 11 (16.2) | 0.705 |
| Smoking, n (%) | 8 (23.5) | 6 (17.6) | 14 (19.1) | 0.564 |
RC, radical cystectomy; RCNU, radical cystectomy and nephroureterectomy; BMI, body mass index; CCI, Charlson comorbidity index; pT stage, pathological tumor stage, according to the pathological grading of bladder tumor; pN stage, pathologic lymph node stage; ASA, American Society of Anesthesiologists score; TURBT, transurethral resection of bladder tumor; HBP, high blood pressure; DM, diabetes mellitus. |
2.2 同期RCNU和单纯RC组患者手术情况及术后并发症比较
表2 两组患者围术期情况及术后并发症对比Table 2 Comparison of perioperative conditions and postoperative complications between the two groups |
| Items | RC alone (n=34) | RCNU (n=34) | All patients | P value |
| Length of hospital stay/d, M (P25, P75) | 12 (8, 18) | 12 (8, 16) | 12 (8, 16) | 0.379 |
| Operation time/min, ${\bar x}$±s | 403.0±36.2 | 465.3±66.3 | 429.9±32.2 | 0.107 |
| Estimated blood loss/mL, M (P25, P75) | 200 (150, 400) | 200 (100, 400) | 200 (150, 400) | 0.923 |
| Clavien complications, n (%) | 0.746 | |||
| Clavien Ⅰ | 19 (55.9) | 18 (52.9) | 37 (54.4) | |
| Clavien Ⅱ | 14 (41.2) | 14 (41.2) | 28 (41.2) | |
| Clavien Ⅲ-Ⅴ | 1 (2.9) | 2 (5.9) | 3 (4.4) | |
| Preoperative albumin, g/L, ${\bar x}$ ±s | 40.52±1.72 | 38.73±1.99 | 40.30±1.21 | 0.150 |
| Postoperative albumin, g/L, ${\bar x}$ ±s | 31.09±1.97 | 30.37±1.78 | 30.64±1.34 | 0.665 |
| Preoperative creatinine/(μmol/L), M (P25, P75) | 87.00 (66.75, 113.00) | 118.50 (86.25, 208.50) | 95.50 (74.50, 140.75) | 0.004* |
| Postoperative creatinine/(μmol/L), M (P25, P75) | 81.00 (63.75, 104.25) | 125.00 (88.75, 242.25) | 101.50 (68.25, 139.75) | 0.001* |
| Creatinine difference/(μmol/L), ${\bar x}$ ±s | 2.49±17.79 | 12.46±17.28 | 7.47±12.13 | 0.430 |
| NLR, n (%) | 0.329 | |||
| ≤4.00 | 17 (50.0) | 21 (61.8) | 38 (55.9) | |
| >4.00 | 17 (50.0) | 13 (38.2) | 30 (44.1) |
*P < 0.05. RC, radical cystectomy; RCNU, radical cystectomy and nephroureterectomy; Creatinine difference=postoperative creatinine-preoperative creatinine; NLR, neutrophil to lymphocyte ratio. |
2.3 两组患者生存情况分析
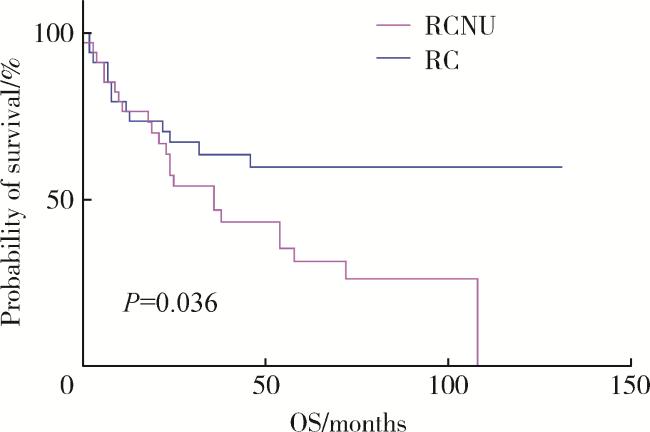
2.4 影响预后的单因素分析
表3 影响患者预后的单因素分析和多因素分析Table 3 Univariate analysis and multivariate analysis of the influence on prognosis of two groups of patients |
| Characteristics | Univariate | Multivariate | |||||
| HR | 95%CI | P | HR | 95%CI | P | ||
| Surgery type | |||||||
| RC | Ref. | ||||||
| RCNU | 2.042 | 1.029-4.053 | 0.037* | 1.043 | 0.439-2.097 | 0.960 | |
| Age at surgery | 1.686 | 0.801-3.301 | 0.122 | ||||
| Gender | |||||||
| Male | Ref. | ||||||
| Female | 1.082 | 0.520-2.253 | 0.833 | ||||
| BMI | 1.014 | 0.913-1.126 | 0.798 | ||||
| CCI | |||||||
| < 2 | Ref. | ||||||
| ≥2 | 1.577 | 0.801-3.105 | 0.184 | ||||
| ASA score | |||||||
| < 3 | Ref. | ||||||
| ≥3 | 2.379 | 1.227-4.614 | 0.008* | 0.976 | 0.332-2.873 | 0.965 | |
| Fundamental disease | |||||||
| ≤1 | Ref. | ||||||
| >2 | 1.294 | 0.672-2.494 | 0.441 | ||||
| Previous tumor history | |||||||
| No | Ref. | ||||||
| Yes | 0.660 | 0.309-1.411 | 0.269 | ||||
| pT stage (MIBC/NMIBC) | |||||||
| ≤pT1 | Ref. | Ref. | |||||
| >pT1 | 2.425 | 1.006-5.845 | 0.031* | 1.422 | 0.552-3.660 | 0.466 | |
| pN stage | |||||||
| ≤N0 | Ref. | Ref. | |||||
| >N0 | 3.545 | 1.687-7.449 | 0.003* | 6.889 | 2.652-17.895 | < 0.001* | |
| NLR | |||||||
| ≤4.00 | Ref. | ||||||
| >4.00 | 1.479 | 0.766-2.856 | 0.243 | ||||
| Number of complications | 1.037 | 0.956-1.125 | 0.437 | ||||
| Postoperative hospital stay | 0.976 | 0.942-1.010 | 0.124 | ||||
| Operation time | 0.998 | 0.993-1.003 | 0.403 | ||||
| Estimated blood loss | 1.001 | 0.999-1.002 | 0.541 | ||||
| Preoperative albumin | 0.416 | 0.204-0.851 | 0.013* | 0.509 | 0.211-1.230 | 0.134 | |
| Postoperative albumin | 1.357 | 0.612-3.009 | 0.456 | ||||
| Preoperative creatinine | 2.718 | 1.406-5.255 | 0.002* | ||||
| Postoperative creatinine | 3.049 | 1.566-5.936 | 0.001* | 4.326 | 1.370-13.656 | 0.013* | |
| Pelvic lymph node dissection | 1.611 | 0.701-3.699 | 0.261 | ||||
* P < 0.05. MIBC, muscle invasive bladder cancer; NMIBC, non-muscle invasive bladder cancer; NLR, neutrophil to lymphocyte ratio (normal range of NLR in healthy adults is 0.88-4.00); Ref., reference. Other abbreviations as in Table 1. |