
补片尿道成形术是针对长段尿道狭窄常用的手术治疗方式,如采用口腔黏膜(oral mucosa, OM)补片[5]及组织工程补片[如小肠黏膜下层、脱细胞真皮基质(acellular dermal matrix, ADM)等]修复长段尿道狭窄[6],但是现有研究多侧重于评估单一材料补片的临床疗效及安全性,对不同材料补片之间的对比研究仍显匮乏[7-8]。本研究分析了2010年5月至2023年9月北京大学第一医院接受补片尿道成形术治疗的27例长段尿道狭窄患者的临床资料,旨在对比评价自体OM(包括舌黏膜、颊黏膜)补片和ADM补片在尿道成形术治疗中的安全性及中长期预后方面的表现,以评估不同材料补片对不同患者的适应性及疗效,为尿道狭窄患者的治疗提供参考和指导。
1 资料与方法
1.1 研究对象
本研究回顾性收集了2010年5月至2023年9月就诊于北京大学第一医院的男性长段尿道狭窄患者的资料,患者年龄18岁以上,且因长段尿道狭窄接受了开放补片(OM补片或ADM补片)尿道成形术。通过病历记录收集患者的基线资料、病因、术前排尿情况及术前治疗情况(接受内镜、开放手术的次数),并结合患者症状、体格检查结果进行综合评估。通过手术记录收集患者尿道狭窄长度、部位及手术时间等资料。本研究获得北京大学第一医院生物医学伦理委员会批准(2022研467),所有患者均签署了知情同意书。
1.2 患者随访
患者分别在术后1、3、6、12个月进行门诊随访,并于2024年10月对患者进行集中电话问询随访。记录包括术后尿管留置时间、并发症发生情况、生活质量(quality of life, QoL)评分及主观排尿评分[国际前列腺症状评分(international prostate symptom score, IPSS)]。因出现排尿困难,需行规律内镜下治疗(如尿道扩张或内切开)或再次手术者,视为术后再次狭窄。
1.3 统计方法
使用R 4.4.1软件进行统计学分析,正态分布的计量资料采用均数±标准差描述,使用t检验进行组间比较;偏态分布的计量资料采用中位数(最小值,最大值)描述,使用秩和检验进行组间比较;计数资料采用例数和百分比描述,使用卡方检验进行组间比较;使用秩和检验进行生存曲线的组间比较。P < 0.05为差异有统计学意义。
2 结果
2.1 患者一般情况
本研究共纳入27例患者,其中OM补片组14例,ADM补片组13例。两组患者在年龄、体重指数(body mass index,BMI)、吸烟史、饮酒史及基础疾病(高血压、糖尿病、心脏病)等方面差异无统计学意义。病因方面,9例医源性狭窄、7例特发性狭窄、6例硬化性苔藓样病、5例外伤。OM补片组的病因以特发性狭窄为主(42.86%,6例),其次为医源性狭窄(35.71%,5例)、外伤(14.29%,2例)、硬化性苔藓样病(7.14%,1例);ADM补片组的病因以硬化性苔藓样病为主(38.46%,5例),其次为医源性狭窄(30.77%,4例)、外伤(23.08%,3例)、特发性狭窄(7.69%,1例),两组的病因分布差异有统计学意义(P=0.035)。OM补片组的患者均为前尿道狭窄,ADM补片组有11例患者(84.62%)为前尿道狭窄,1例为后尿道狭窄,1例为全尿道狭窄。两组患者尿道狭窄的长度差异无统计学意义,OM补片组为4.5 (2.5, 9.0) cm,ADM补片组为5.0 (2.0, 14.0) cm (P=0.555)。两组患者术前的手术治疗次数差异无统计学意义(P=0.652),ADM补片组的中位手术时间比OM补片组短26 min(P=0.065)。具体见表 1。
表1 两组患者一般人口学特征及手术基本信息的比较Table 1 Comparison of demographic and surgical characteristics between two groups |
| Characteristics | Group | P value | |
| OM | ADM | ||
| Patient number | 14 | 13 | |
| Age/years, ${\bar x}$±s | 43.3±14.0 | 54.2±15.9 | 0.071 |
| BMI/(kg/m2), ${\bar x}$±s | 24.7±4.3 | 25.4±4.8 | 0.717 |
| Smoking history, n (%) | 3 (21.43) | 3 (23.08) | 0.946 |
| Alcohol use history, n (%) | 2 (14.29) | 0 (0) | 0.181 |
| Comorbidities, n (%) | |||
| Hypertension | 2 (14.29) | 1 (7.69) | 0.624 |
| Diabetes | 0 (0) | 3 (23.08) | 0.068 |
| Cardiovascular disease | 2 (14.29) | 0 (0) | 0.181 |
| Etiology, n (%) | 0.035 | ||
| Trauma | 2 (14.29) | 3 (23.08) | |
| Lichen sclerosus | 1 (7.14) | 5 (38.46) | |
| Iatrogenic | 5 (35.71) | 4 (30.77) | |
| Idiopathic | 6 (42.86) | 1 (7.69) | |
| Stricture site, n (%) | 0.149 | ||
| Anterior urethra | 14 (100.00) | 11 (84.62) | |
| Posterior urethra | 0 (0) | 1 (7.69) | |
| Entire urethra | 0 (0) | 1 (7.69) | |
| Stricture length/cm, median (min, max) | 4.5 (2.5, 9.0) | 5.0 (2.0, 14.0) | 0.555 |
| Prior surgeries, n (%) | 0.652 | ||
| 0 | 6 (42.86) | 4 (30.77) | |
| 1 | 1 (7.14) | 4 (30.77) | |
| 2 | 2 (14.29) | 2 (15.38) | |
| 3 | 0 (0) | 2 (15.38) | |
| 4 | 0 (0) | 0 (0) | |
| ≥5 | 5 (35.71) | 1 (7.69) | |
| Operative duration/min, median (min, max) | 160 (71, 221) | 134 (112, 274) | 0.065 |
OM, oral mucosa; ADM, acellular dermal matrix; BMI, body mass index; min, minimum; max, maximum. |
2.2 OM和ADM补片的安全性及疗效评价
术后随访中,OM补片组患者的中位随访时间为12.5 (1.0, 170.0)个月,ADM补片组患者的中位随访时间为59.0 (3.0, 142.0)个月。
安全性方面,OM补片组有3例患者出现性功能障碍,主要表现为性功能下降以及性生活牵扯感;2例患者出现口腔并发症,其中1例表现为术后口腔疼痛,1例表现为术后味觉障碍。ADM补片组除1例患者出现术后伤口感染外,其余患者均未出现相关并发症。病因分组统计显示,OM补片组中出现术后性功能障碍患者的病因均为特发性尿道狭窄,ADM补片组出现术后感染的患者病因为苔藓性硬化样病(表 2)。
表2 不同病因分型下两种修复术式临床疗效和安全性指标的比较Table 2 Comparison of clinical efficacy and safety between two surgical repair grafts across etiological subtypes |
| Etiology (n) | Group (n) | Restricture rate, n (%) | Median restricture time/months | Complication (n) |
| Trauma (5) | OM (2) | 1 (50.0) | 3 | Oral pain (1) |
| ADM (3) | 1 (33.3) | 6 | ||
| Lichen sclerosus (6) | OM (1) | 0 (0) | ||
| ADM (5) | 3 (60.0) | 6 | Postoperative infection (1) | |
| Iatrogenic (9) | OM (5) | 3 (60.0) | 3 | Dysgeusia (1) |
| ADM (4) | 2 (50.0) | 4.5 | ||
| Idiopathic (7) | OM (6) | 3 (50.0) | 3 | Sexual dysfunction (3) |
| ADM (1) | 0 (0) |
OM, oral mucosa; ADM, acellular dermal matrix. |
疗效评估方面,两组患者在术前及末次随访的QoL评分和IPSS主观排尿评分差异均无统计学意义(P术前QoL=0.275,P术前IPSS=0.800,P术后QoL=0.358,P术后IPSS=0.547),见表 3。
表3 两组患者随访指标的比较Table 3 Comparative analysis of follow-up indicators between two groups |
| Indicators | Group | P value | |
| OM | ADM | ||
| Preoperative QoL, median (min, max) | 5.0 (5.0, 6.0) | 6.0 (4.0, 6.0) | 0.275 |
| Preoperative IPSS, median (min, max) | 20.5 (9.0, 31.0) | 20.0 (15.0, 32.0) | 0.800 |
| Catheterization duration/months, median (min, max) | 1.5 (1.0, 6.0) | 3.0 (1.0, 3.0) | 0.018 |
| Restricture rate, n (%) | 7 (50.00) | 6 (46.15) | 0.867 |
| Restricture time/months, median (min, max) | 2.5 (1.3, 8.0) | 5.0 (1.5, 12.0) | 0.163 |
| Postoperative QoL, median (min, max) | 1.0 (0, 5.0) | 1.0 (0, 5.0) | 0.358 |
| Postoperative IPSS, median (min, max) | 5.5 (3.0, 14.0) | 7.0 (2.0, 14.0) | 0.547 |
M, oral mucosa; ADM, acellular dermal matrix; QoL, quality of life; IPSS, international prostate symptom score; min, minimum; max, maximum. |
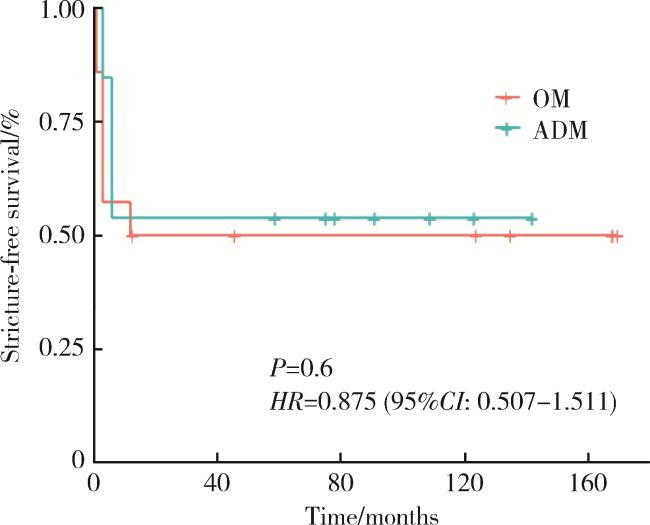
OM补片组患者的中位尿管留置时间为1.5个月,ADM补片组患者的中位尿管留置时间为3.0个月。OM补片组有50.00%(7例)的患者术后发生了再狭窄,ADM补片组有46.15%(6例)的患者发生了术后再狭窄。由术后再狭窄发生的时间上看,ADM补片组患者的再狭窄发生时间较晚[OM补片组为2.5 (1.3, 8.0)个月,ADM补片组为5.0 (1.5, 12.0)个月,P=0.163]。K-M曲线分析显示,两组患者的无狭窄生存率差异无统计学意义(图 1)。
病因分组统计显示,与ADM补片组相比,OM补片组的再狭窄发生率普遍较高,中位再狭窄时间相对较早(表 2)。
3 讨论
长段尿道狭窄是尿道狭窄的一种特殊类型,主要指尿道狭窄长度超过2 cm的患者,开放尿道成形术是治疗长段尿道狭窄的常用手术方法。尽管OM补片和组织工程材料补片已被证明能够有效重建尿道通畅性,但现有研究往往仅关注单一补片材料的疗效评价,对不同补片材料安全性及疗效的对比研究仍然缺乏。本研究通过回顾性收集并随访了近13年因尿道狭窄就诊于北京大学第一医院泌尿外科并于术中确诊为长段尿道狭窄的男性患者,采用横向对比和纵向随访评估了OM补片和ADM补片在治疗长段尿道狭窄中的疗效及安全性。
按照传统观点,尿道狭窄常见的病因包括外伤、医源性、硬化性苔藓样病、特发性等。国内研究表明,外伤是尿道狭窄最常见的病因,约占50%[9]。然而,本研究发现长段尿道狭窄患者的病因分布呈现新的特点,医源性狭窄为最常见的病因,其次为特发性、硬化性苔藓样病及外伤。医源性狭窄常见于导尿、前列腺电切术后及尿道下裂修复术后等。特发性尿道狭窄是指无特殊外伤、感染或就医史,突发或缓慢进展的以排尿困难、滴沥甚至急性尿闭为主诉,排除其他疾病后诊断的尿道狭窄。Hevia等[10]的研究表明,与硬化性苔藓样病导致的尿道狭窄相比,特发性尿道狭窄患者的狭窄长度较短,在多变量分析中,特发性尿道狭窄并不是尿道重建术后预后不良的危险因素。本研究中,硬化性苔藓样病是发病率次于医源性及特发性尿道狭窄的病因,是指发生于会阴、生殖器区域的一种特殊炎症性疾病,可能导致尿道外口,甚至复杂的超长段全尿道狭窄,由于其可能发展为鳞状细胞癌,因此对该类患者往往需要在术中取活检行病理检查,并在术后进行长期观察和随访。
补片尿道成形术是指使用补片材料替代狭窄或缺如的尿道组织,结合残余尿道重建管型结构,从而实现尿道通畅。常用的补片材料包括自体组织(如舌黏膜、颊黏膜)和组织工程材料补片(如ADM、小肠黏膜下层等)。OM补片是在局部组织条件不佳、无法原位对合时常选用的一种自体组织补片材料,已被广泛证明能够有效重建尿道。组织工程材料补片中,本研究组的既往研究已证明ADM补片可用于尿道重建,尿道镜检查显示,重建区域能够被尿路上皮覆盖且与自体组织外观类似[11]。小肠黏膜下层材料的应用也得到了证实,徐月敏等[12]的研究显示,修复后,尿道镜下可见修复区域与周围组织界限消失,黏膜光滑且完整。目前国际上对于不同补片材料的对比研究较为匮乏,Palminteri等[13]选择了50例因尿道球部狭窄行补片修补的患者(25例颊黏膜补片,25例小肠黏膜下层补片),结果显示颊黏膜组的修补成功率为83.4%,小肠黏膜下层组的修补成功率为68.0%,多变量回归分析显示,使用小肠黏膜下层补片是尿道补片成形术后再狭窄发生的独立危险因素。本研究比较了OM补片与ADM补片的疗效差异,长期随访结果显示,两组患者的术后无狭窄生存率相当,组间差异无统计学意义,尽管两组患者间的病因分布存在差异,ADM补片组中纳入了更多硬化性苔藓样病患者,通常这类患者具有更加严重且复杂的尿道狭窄。Abramowitz等[14]通过一项meta分析指出,使用OM修补而非皮瓣修复是该类患者手术成功的关键。本研究在两组患者病因分布具有组间差异的前提下,ADM补片仍然显示出了与OM补片相当的手术成功率,且两组患者的无狭窄生存率差异无统计学意义。病因分组统计显示,ADM补片组的再狭窄发生率普遍低于OM补片组,提示ADM补片在治疗长段尿道狭窄,尤其是因硬化性苔藓样病引起的复杂超长段尿道狭窄,具有一线选择的潜力,但受限于本研究小样本量的局限性,仍需要进行更大规模的队列研究以进一步验证。本研究观察到不同病因亚组间的疗效存在差异,但因部分亚组样本量较小,结论的可靠性可能受限,需扩大队列进一步验证组间效应的异质性。
安全性方面,本研究的两组患者均无严重并发症发生,ADM补片组仅1例患者出现术后感染,OM补片组有3例患者出现术后性功能障碍,2例患者出现口腔疼痛、味觉障碍等口腔并发症。Phan等[15]的研究指出,麻醉持续时间延长是术后并发症发生的独立危险因素。本研究结果显示,相较于OM组,ADM组的中位手术时间缩短了26 min,表明该组患者的围手术期管理更为安全。
本研究存在一定的局限性,首先,本研究为回顾性队列研究,样本量有限且因果关系推断受限,存在选择偏倚,缺乏多中心验证;其次,本研究将使用颊黏膜和舌黏膜补片的患者统一划分为OM组,但颊黏膜和舌黏膜补片在围手术期情况及手术成功率上存在差异,需进一步进行多中心前瞻性多亚组队列研究(区分舌黏膜组、颊黏膜组、ADM组),以验证本研究的结论。
综上所述,长段尿道狭窄是尿道狭窄领域较为棘手的情况之一,OM和ADM补片均能够有效进行尿道重建。ADM补片在长段尿道狭窄修复中展现出了与OM补片相当的远期通畅率及安全性,表明ADM补片在治疗长段尿道狭窄,尤其是因硬化性苔藓样病引起的超长段复杂尿道狭窄中或许能够成为尿道补片重建材料的一线选择,但是鉴于本研究的样本量较小,上述结论仍需要更大规模、多中心、前瞻性、多亚组的队列研究以进一步验证。