
目前,关于3D打印氧化锆的研究多集中于其尺寸精度及表面特征,尚未见关于3D打印氧化锆的疲劳性能研究报道,将多孔表面与3D打印氧化锆相结合,其疲劳性能需要进一步探究。本研究利用立体光固化成型技术在氧化锆表面设计多孔结构,明确多孔表面结构对氧化锆表面特征和疲劳强度的影响,为3D打印多孔表面氧化锆种植体结构优化设计提供参考。
1 资料与方法
1.1 立体光固化成型氧化锆试件的设计、分组与制备
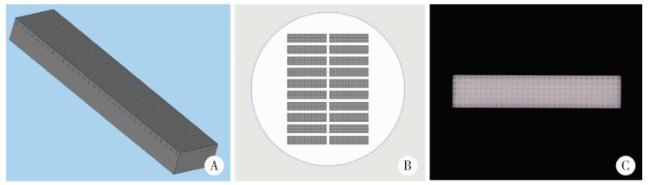
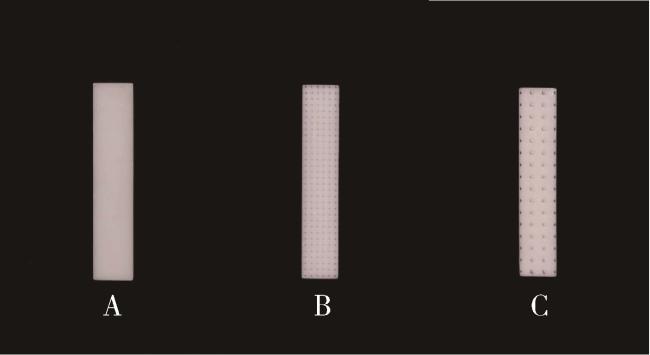
在正向建模软件(SolidWorks 2020,Dassault Systemes公司,美国)中设计长20 mm、宽4 mm、厚度2 mm的长条试件,在其中一个20 mm×4 mm的表面上设计互相连通的多孔结构,孔隙率依据30%设计。依据不同的孔径设计多孔表面氧化锆试件,依次保存为.STL格式文件。实验分组如下:(1)无孔组:表面无多孔结构设计;(2)200 μm孔组:表面孔隙直径设计值为200 μm,孔隙深度设计值为400 μm,孔间距设计值为430 μm;(3)400 μm孔组:表面孔隙直径设计值为400 μm,孔隙深度设计值为600 μm,孔间距设计值为860 μm。
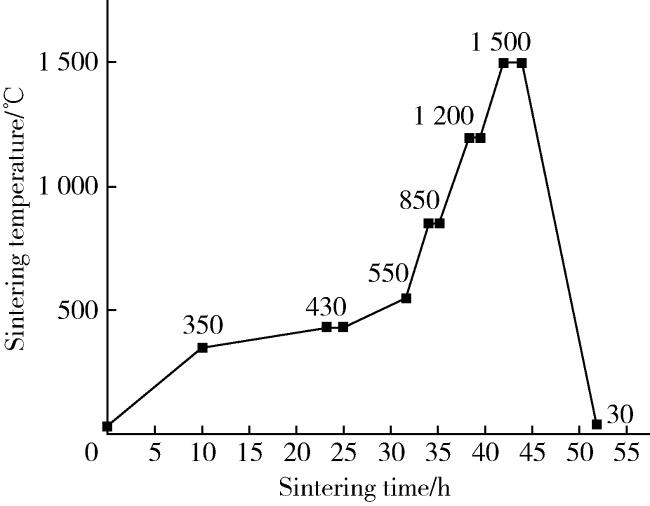
将各组保存的.STL格式文件分别导入Materialise Magics软件(Magics 21,Materialise公司,比利时),依据立体光固化成型氧化锆材料的烧结收缩率,在软件中相应放大试件,设置打印层厚为25 μm,软件计算并生成.SLC切片文件(图 1)。
1.2 立体光固化成型氧化锆试件的表面形貌特征观察
每组随机选取6个试件,将试件先后于丙酮、无水乙醇、纯水中超声荡洗20 min,室温下干燥24 h,其中3个试件通过3D激光形貌显微镜(Keyence公司,日本)测量表面粗糙度,多孔表面试件测定其孔隙间平整区域的表面粗糙度。测量的表面粗糙度参数值包括轮廓算术平均偏差Ra、轮廓均方根偏差Rq和微观不平度十点高度Rz。同时对多孔组试件进行孔隙参数测量,每组共测量10个不同视野,每个视野内至少包括一个孔隙结构,主要测量参数有孔隙直径、孔隙深度和相邻孔隙间距。另外3个试件于扫描电镜(SU8010,Hitachi公司,日本)下观察表面形貌,明确氧化锆试件表面微观形貌特征。
1.3 立体光固化成型氧化锆试件表面晶粒尺寸
将每组3个氧化锆试件按上述步骤清洗后于扫描电镜下观察表面,在15 000倍放大倍率下拍摄图片。将图片导入ImageJ软件(ImageJ 1.51,NIH公司,美国)中,采用直线截点法测量平均晶粒尺寸,选取直线及截点方法参考国家标准[5],每组试件至少选取3个视野,每组试件至少一共获得50个以上的截点。依据下列公式计算平均晶粒尺寸:
式中L为直线线段长度;N为线段穿过晶粒总数(即截点数)。
1.4 立体光固化成型氧化锆试件的三点弯曲试验及疲劳试验
1.5 立体光固化成型氧化锆试件表面晶相分析
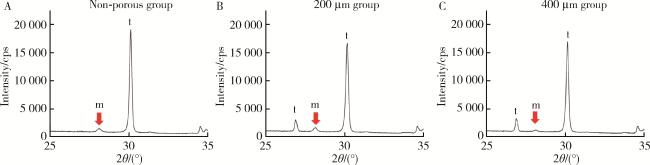
选取未进行试验的各组试件各3枚,疲劳试验后未折断的各组试件各3枚,疲劳试验后折断的各组试件各3枚,通过X射线衍射仪(D/max 2500,Rigaku公司,日本)进行表面晶相分析,参数为铜靶,步长0.02°,速度1 s/步,衍射角(2θ)扫描范围25°~35°,根据下列公式计算单斜相(m相)氧化锆的体积百分数:
其中,$X_{\mathrm{m}}$ 为单斜相峰值强度比,$I_{\mathrm{m}(111)}$、$I_{\mathrm{m}(\overline{1} 11)}$、$I_{\mathrm{t}(111)}$ 分别表示衍射角在$31^{\circ}、28^{\circ}、30^{\circ}$ 附近的峰值强度,$V_{\mathrm{m}}$ 为单斜相氧化锆的体积百分数。
1.6 立体光固化成型氧化锆试件疲劳断口的扫描电镜观察
将疲劳折断的氧化锆试件于扫描电镜下观察裂纹源位置,观察疲劳裂纹扩展形态,断口形态分区及高倍镜下分析晶粒、晶界断裂情况,进一步分析疲劳机制。
1.7 统计学分析
采用SPSS 21.0软件,对各组立体光固化成型氧化锆试件的表面粗糙度、晶粒尺寸、三点弯曲强度及疲劳强度进行正态性检验及方差齐性检验,若数据符合正态分布且方差齐采用单因素方差分析,两组间的均值比较采用LSD检验;若数据不符合正态分布或方差不齐,则采用非参数检验。多孔参数采用独立样本t检验。采用双侧检验,P<0.05为差异具有统计学意义。
2 结果
2.1 表面形貌观察与测量
无孔组试件与两组多孔试件孔间的表面粗糙度见表 1,各组间相比差异无统计学意义(P>0.05)。
表1 氧化锆试件孔间粗糙度Table 1 The roughness of surface between pores of zirconia specimens |
| Group | Ra/μm | Rq/μm | Rz/μm |
| Non-porous | 0.79±0.09 | 0.98±0.21 | 8.17±1.02 |
| 200 μm | 0.81±0.16 | 1.06±0.18 | 8.79±1.48 |
| 400 μm | 0.81±0.09 | 1.05±0.11 | 8.31±0.89 |
All data are expressed as ${\bar x}$±s. |
多孔表面氧化锆试件表面孔隙参数测量结果见表 2,200 μm孔组孔径及孔间距与设计值的差异无统计学意义,但孔深度小于设计值,差异有统计学意义(P<0.001);400 μm孔组孔径、孔深度均小于设计值,差异有统计学意义(P<0.05),由于孔径偏小,导致孔间距大于设计值,差异有统计学意义(P<0.001)。
表2 多孔氧化锆试件表面孔隙参数测量Table 2 Measurement results of porous parameters of zirconia specimen |
| Group | Design value of pore diameter/μm | Measured value of pore diameter/μm, ${\bar x}$±s | Design value of pore depth/μm | Measured value of pore depth/μm, ${\bar x}$±s | Design value of pore-pitch/μm | Measured value of pore-pitch/μm,${\bar x}$±s |
| 200 μm | 200.00 | 200.02±6.15 | 400.00 | 379.35±11.22** | 430.00 | 429.08±9.31 |
| 400 μm | 400.00 | 366.48±6.88** | 600.00 | 572.84±29.35* | 860.00 | 883.99±9.41** |
*P < 0.05, compared with corresponding design value; * *P < 0.001, compared with corresponding design value. |
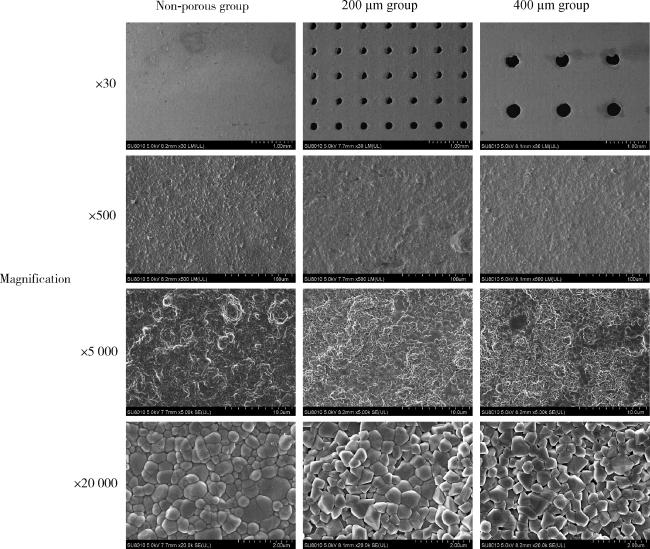
各组氧化锆试件表面微观形貌如图 5所示,低倍镜下两组多孔表面氧化锆试件孔形态良好,在500至5 000倍镜下观察,3组试件表面平整区域形貌未见明显区别。在20 000倍镜下观察,两组多孔表面氧化锆试件可见晶粒间存在间隙,晶粒边缘锐利;而无孔组氧化锆试件晶粒相对较圆钝,晶粒间未见明显间隙。
2.2 表面晶粒尺寸
各组氧化锆试件的平均晶粒尺寸如表 3,组间相比差异无统计学意义(P>0.05)。
表3 氧化锆试件表面晶粒尺寸Table 3 Surface grain size of zirconia specimen |
| Group | Average grain size/nm, ${\bar x}$±s |
| Non-porous | 324.11±21.38 |
| 200 μm | 308.06±11.34 |
| 400 μm | 311.62±15.02 |
2.3 立体光固化成型氧化锆试件的弯曲强度及疲劳强度
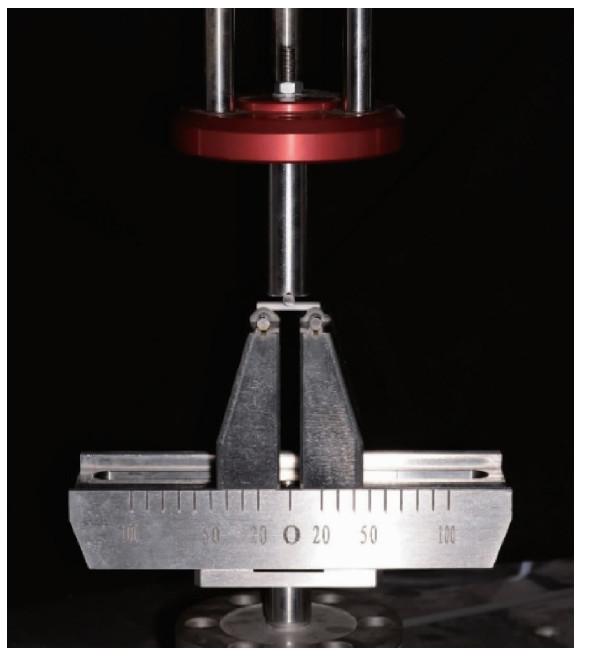
各组氧化锆试件三点弯曲强度及疲劳强度见表 4,无孔组试件弯曲强度显著高于200 μm孔组、400 μm孔组试件(P<0.001);200 μm孔组三点弯曲强度显著高于400 μm孔组(P<0.01)。无孔组试件疲劳强度显著高于200 μm孔组、400 μm孔组试件(P<0.001);200 μm孔组疲劳强度显著高于400 μm孔组(P<0.001),可见表面孔隙直径的增大造成了试件弯曲强度和疲劳强度的下降。
表4 氧化锆试件三点弯曲强度及疲劳强度Table 4 Three point flexural strength and fatigue strength of zirconia specimens |
| Group | Three-point flexural strength/MPa, ${\bar x}$±s | Fatigue strength/MPa, ${\bar x}$±s | Characteristic strength/MPa | 95%CI | Weibull modulus | 95%CI |
| Non-porous | 1 030.70±111.71 | 702.29±21.62 | 1 080.10 | 1 027.12-1 135.91 | 10.61 | 7.23-15.84 |
| 200 μm | 272.04±61.16 | 159.57±9.30 | 296.40 | 264.97-331.55 | 4.80 | 3.29-6.99 |
| 400 μm | 201.21±25.58 | 125.36±6.11 | 211.68 | 201.25-222.66 | 10.50 | 6.89-15.99 |
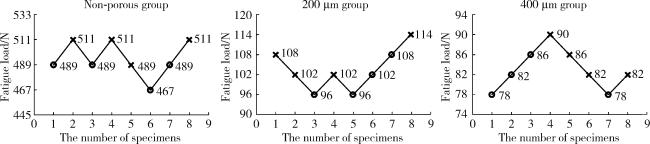
各组氧化锆试件疲劳强度试验升降曲线见图 6,为满足试验结束条件,使升降图达到闭合,无孔组11个试件进行了疲劳试验,200 μm孔组12个试件进行了疲劳试验,400 μm孔组9个试件进行了疲劳试验。
2.4 立体光固化成型氧化锆试件表面晶相分析
表5 氧化锆试件表面单斜晶相比例Table 5 Monoclinic phase ratio of zirconia specimen surface |
| Group | Before fatigue test | Unbroken after fatigue test | Broken after fatigue test | |||||
| Xm | Vm | Xm | Vm | Xm | Vm | |||
| Non-porous | 9.51% | 12.09% | 10.78% | 13.67% | 10.42% | 13.23% | ||
| 200 μm | 10.01% | 12.72% | 11.17% | 14.14% | 10.43% | 13.25% | ||
| 400 μm | 9.64% | 12.27% | 9.69% | 12.34% | 10.42% | 13.22% | ||
Monoclinic phase peak intensity ratio(Xm), and monoclinic phase volume ratio (Vm). |
2.5 立体光固化成型氧化锆试件疲劳断口分析
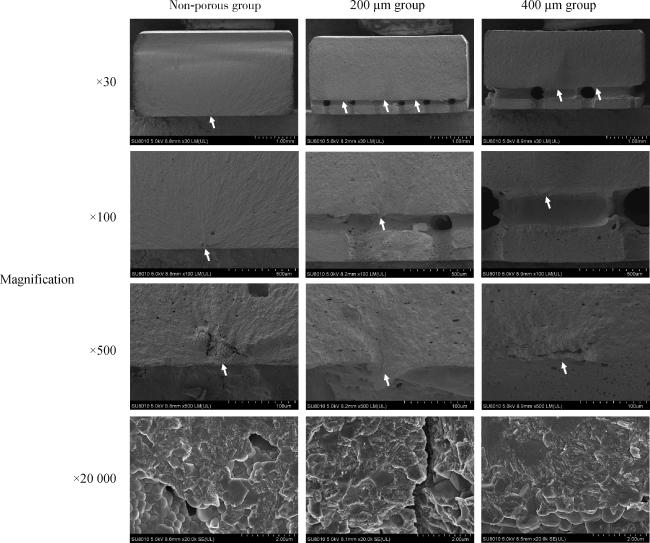
各组氧化锆试件疲劳破坏断口的扫描电镜观察见图 8,低倍镜下,无孔组试件可见疲劳裂纹由单个裂纹源向试件各个外表面呈典型放射状扩散,200 μm组及400 μm组可见2个或2个以上的裂纹源,疲劳裂纹扩散形态不规则,可见多数裂纹存在交汇现象。无孔组试件整体较致密,内部气孔较少;200 μm组及400 μm组可见气孔数量较无孔组更多,且多孔结构内见堵塞现象。无孔组试件疲劳裂纹源多位于试件表面的加工缺陷;多孔表面氧化锆试件的裂纹大多起源于孔隙间连通处的底部,裂纹可来源于材料内部缺陷、气孔、杂质或打印层结合部。20 000倍镜下见各组疲劳断口表面晶粒存在碎裂现象,晶界模糊,表明发生了穿晶断裂;断口表面可见小部分完整晶粒,表明小部分区域存在沿晶断裂。整体断裂模式为以穿晶断裂为主的混合断裂模式。


3 讨论
本研究结果表明,通过立体光固化成型技术可在氧化锆表面形成规则排列的多孔结构,氧化锆表面多孔结构造成了试件弯曲强度及疲劳强度的下降,且随着孔径的增大,疲劳强度呈下降趋势。
3.1 立体光固化成型加工技术
多数实验证明,经过粗化处理的表面更有利于种植体骨结合[12-14]。目前,常用的增加氧化锆表面粗糙度的方式主要为喷砂或喷砂加酸蚀技术,形成的表面微观结构相对表浅、不规则、不可控。本研究中立体光固化成型获得的多孔表面氧化锆试件可以不需要额外表面处理,避免了外源性缺陷的引入,更重要的是可调控表面微观结构的尺寸和分布,孔隙结构可控。根据Boyan等[15]及Hadjicharalambous等[16]的研究,孔隙直径为200~400 μm的表面能促进成骨细胞的黏附、增殖和分化,故本研究选择200 μm及400 μm作为多孔表面氧化锆试件的孔隙直径。结合表面的孔隙结构,理论上可达到较好的骨结合效果[4, 17],但多孔表面氧化锆的生物学效应需要进一步实验验证。
3.2 立体光固化成型氧化锆试件的疲劳强度及影响因素
3.2.1 氧化锆的晶粒尺寸及晶相组成
晶粒尺寸越小,单位体积内的晶界越多,裂纹扩展的路径越曲折,增大了同等距离裂纹拓展所需要消耗的能量,使氧化锆陶瓷对裂纹的抵抗性越强[18]。多项研究均证实,在一定范围内氧化锆的晶粒越小,氧化锆材料的力学性能越好[19-20]。本研究中3组氧化锆试件表面晶粒尺寸在300 nm左右,多孔组试件表面的晶粒之间存在间隙,而无孔组试件晶粒间未见明显气孔及间隙,晶粒间结合不佳可能是导致多孔组试件强度下降的一个原因。此外,晶粒尺寸的均一性也是影响力学强度的一个重要因素,本研究对试件表面观察发现,多数表面存在多个小晶粒包绕一个大晶粒的现象,晶粒的均一性下降。本研究中多孔组试件表面单斜晶相百分率与无孔组试件的差异无统计学意义,因而排除了晶相组成的差异对强度造成的影响。经过疲劳试验的试件,表面单斜相比例上升,这与既往研究结果相似[21]。
3.2.2 材料内部微观结构缺陷
根据氧化锆疲劳断裂的亚临界微裂纹扩展理论,氧化锆材料对缺陷敏感,表面或内部微小裂纹可以在外界应力的作用下缓慢增长,达到临界尺寸后迅速扩展,最终导致材料失效断裂[22]。多孔结构增加了试件打印的复杂程度,增加了打印激光行进路径的距离,可能造成局部激光固化不充分,导致微观缺陷的产生。浆料的流动性也对打印试件的尺寸精度及力学性能有重要影响。浆料的固含量增加有助于防止试件收缩变形并提高致密度,然而过高的固含量则增加了浆料黏稠度,降低了浆料对打印形状的适应性[23]。结合既往文献[24],本研究认为试件成型结构复杂、打印浆料的流动性差,均可能会导致打印试件气孔的产生增多,导致材料内部结合力差,从而影响力学强度。对本研究中氧化锆试件的疲劳断口扫描电镜分析可见,多孔氧化锆试件内部气孔较无孔组更多,疲劳裂纹源多位于表面多孔层与下方致密层的交界处,可出现两个或两个以上裂纹源,这表明材料内部缺陷较多,在疲劳载荷作用下产生多个应力集中部位,造成疲劳强度的下降。Weibull模数m可代表材料均一性和可靠性,m值越大,材料均一性越好。大多数陶瓷材料的Weibull模数m值为5~15[25],本研究中200 μm孔组的试件Weibull模数较无孔组及400 μm孔组降低,推测原因为200 μm试件表面孔径较小,且浆料具有一定的黏性,使得多孔结构内部材料难以完全清理,导致材料的均一性下降。在图 8中可见200 μm孔组试件多孔结构内部存在未能完全清理的氧化锆浆料。
3.2.3 3D打印层结合界面
打印层结合部可能是影响3D打印氧化锆力学强度的薄弱环节之一。研究表明[26],打印层的厚度、曝光能量及时间是影响打印层结合效果的关键因素,在一定范围内,更薄的打印层及更高的曝光能量可以使打印层间结合更好;过高的曝光能量会导致零件尺寸过大,过低的曝光能量则不能保证零件稳定的形成。本研究中,打印层选择了设备允许的最小厚度25 μm,曝光能量及时间应依据层厚及打印精度要求进行调试,选取最优组合,可能有助于提高氧化锆的力学性能。此外,打印层的结合面积也是影响结合力的因素[27],本研究中多孔组试件由于存在一定厚度的多孔结构,表面多孔层与下方致密层层间总结合面积相较于无孔组小,可能导致层间结合力不足,在交界处出现较多缺陷,进而成为疲劳裂纹源,造成疲劳强度的下降。
3.2.4 3D打印层的堆叠方向
Osman等[2]研究了不同打印角度的氧化锆圆盘试件的双轴弯曲强度,结果提示打印层的堆叠方向与力的方向所成的角度对3D打印氧化锆试件的力学强度有重要影响,打印层堆叠界面与加载力呈90°(打印角度0°)时,加载力需要克服的主要是晶粒间的结合力,因而弯曲强度较高,故本研究中氧化锆试件均选择0°角度打印(试件长轴与打印加工平面平行,多孔结构面向上打印)。
综上所述,本研究认为未来可以从以下方面提高立体光固化成型氧化锆的疲劳强度:(1)调节氧化锆打印浆料中固液相占比[24],从而控制其流动性以适应复杂形状,减少气孔的产生;(2)在保证一定流动性的同时,细化氧化锆晶粒;(3)根据不同的打印精度要求,设置合理的打印层厚、曝光能量及时间等打印参数;(4)改进打印后清理、烧结程序,尽可能清理复杂形状内残留的打印浆料,同时选用合理的烧结程序增加氧化锆晶粒间的结合;(5)结合本研究结果,基于现有3D打印技术,应在打印精度允许范围内减小孔隙尺寸,减少孔隙结构对多孔氧化锆力学强度的影响。
本研究是体外疲劳试验,能在一定程度上模拟咀嚼应力对试件的疲劳效应。但是口腔内环境复杂,在唾液的水分子作用下,氧化锆材料容易产生低温老化现象。未来应继续深入探究低温老化效应对3D打印氧化锆力学性能的影响。此外,若能充分协调好打印陶瓷浆料、打印工艺、清洗、脱脂及烧结技术各层之间的关系,制备出的3D打印氧化锆可能会有更好的力学强度。本研究多孔结构对氧化锆种植体疲劳强度的影响亦有待进一步研究。
表面多孔结构会显著降低3D打印氧化锆试件的疲劳强度,且随着孔径的增大,疲劳强度呈下降趋势。材料内部缺陷、气孔、夹杂及3D打印层结合处等可能是疲劳裂纹主要起源位置。未来若将多孔表面应用到种植体上时应进一步优化表面设计,并改进3D打印材料和工艺,以提升3D打印多孔表面氧化锆的力学性能。