
1 资料与方法
1.1 转录组数据集
1.2 差异表达的铁死亡相关基因的功能富集分析
1.3 铁死亡相关lncRNA预测模型的构建
1.4 统计学分析
2 结果
2.1 铁死亡相关基因的富集分析
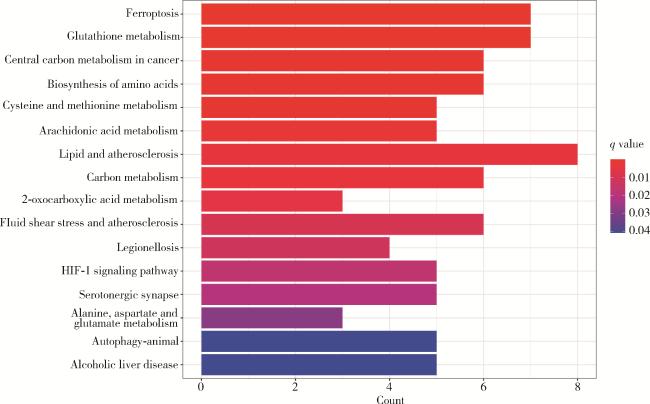
图1 KEGG数据库中铁死亡相关差异基因通路的富集分析Figure 1 Enrichment analysis of pathways for ferroptosis-related differential genes in the KEGG database HIF-1, hypoxia-inducible factor-1; KEGG, Kyoto encyclopedia of genes and genomes. |
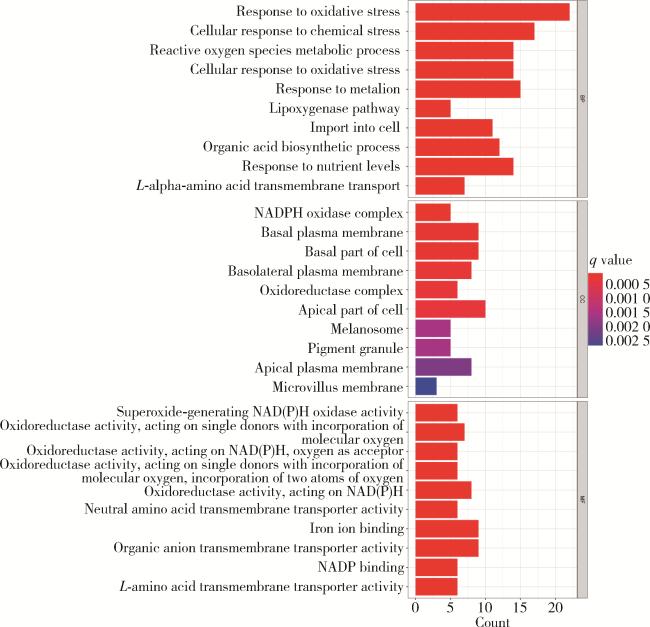
图2 GO数据库中铁死亡相关差异基因代谢的富集分析Figure 2 Enrichment analysis of metabolic pathways for ferroptosis-related differential genes in the GO database BP, biological process; CC, cellular component; MF, molecular function; NAD(P)H, nicotinamide adenine dinucleotide phosphate-reduced; NADP, nicotinamide adenine dinucleotide phosphate; GO, gene ontology. |
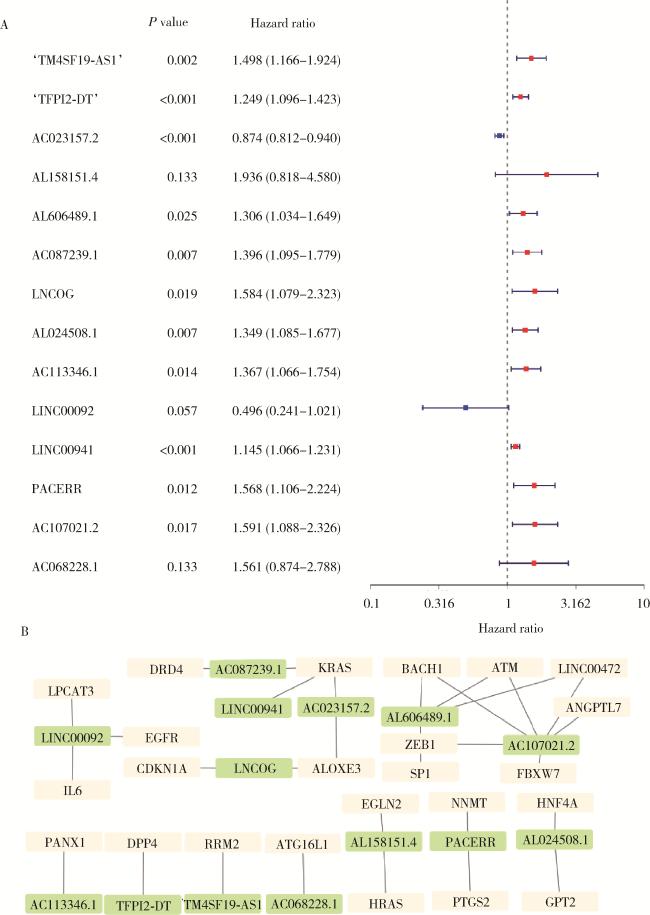
2.2 铁死亡相关lncRNA筛选
2.3 预测模型与非小细胞肺癌患者预后的相关性
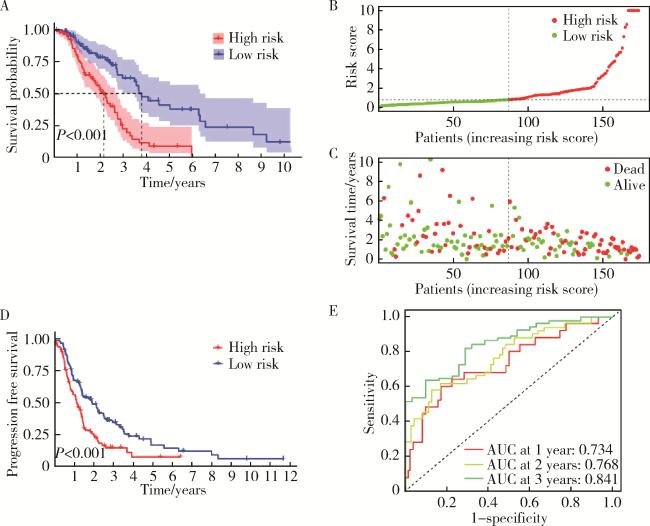
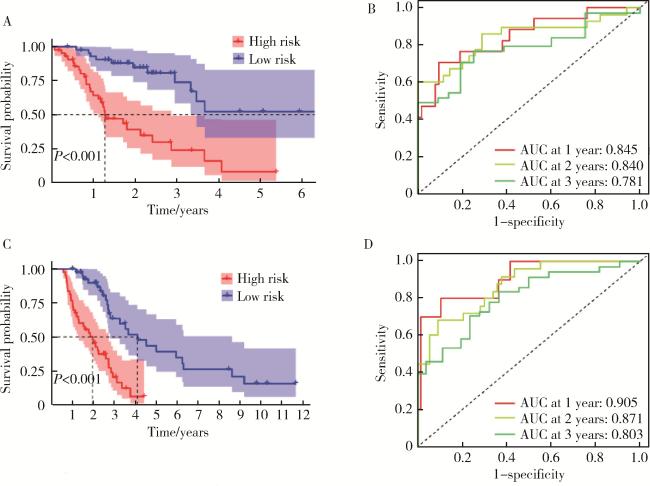
图4 预测模型与非小细胞肺癌患者预后的相关性Figure 4 Correlation between the predictive model and the prognosis of patients with non-small cell lung cancer A, the overall survival time for the high-risk and low-risk groups; B, the horizontal axis represented patients arranged in increasing order of risk score, and the vertical axis represented the specific risk score values; C, the relationship between risk score and survival time; D, progression free survival in the high risk and low risk groups; E, the ROC curves for 1 year, 2 year, and 3 year survival. ROC, receiver operating characteristic curve; AUC, area under curve. |
2.4 不同临床病理变量与预后的关系
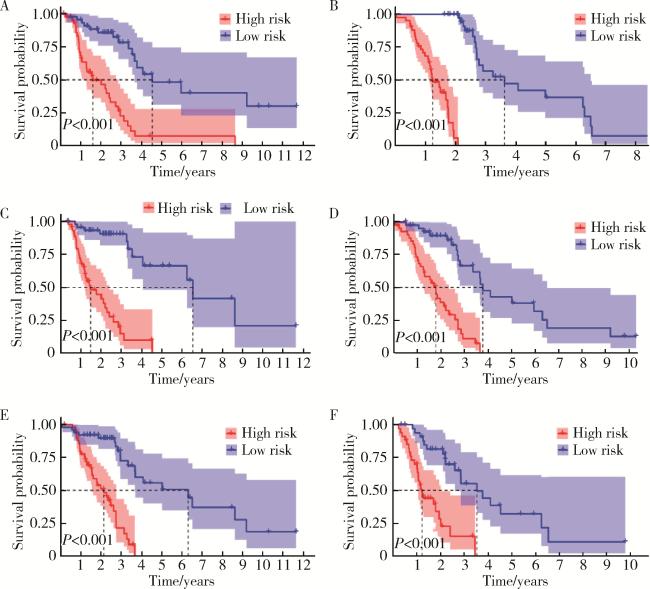
2.5 预测模型的内部验证
表1 训练数据集和验证数据集患者临床特征Table 1 Clinical characteristics of patients in the training dataset and validation dataset |
| Items | Total number of datasets (n=175) | Training dataset (n=88) | Validation dataset (n=87) |
| Age/years, n (%) | |||
| ≤65 | 90 (51.43) | 45 (51.14) | 45 (51.72) |
| >65 | 85 (48.57) | 43 (48.86) | 42 (48.28) |
| Gender, n (%) | |||
| Male | 84 (48.00) | 43 (48.86) | 41 (47.13) |
| Female | 91 (52.00) | 45 (51.14) | 46 (52.87) |
| Stage, n (%) | |||
| Ⅰ+Ⅱ | 103 (58.86) | 49 (55.68) | 54 (62.07) |
| Ⅲ+Ⅳ | 69 (39.43) | 37 (42.05) | 22 (25.29) |
| Unknown | 3 (1.71) | 2 (2.27) | 1 (1.15) |
| T, n (%) | |||
| T1+T2 | 133 (76.00) | 69 (78.41) | 64 (73.56) |
| T3+T4 | 40 (22.86) | 18 (20.45) | 22 (25.29) |
| TX+unknown | 2 (1.14) | 1 (1.14) | 1 (1.15) |
| M, n (%) | |||
| M0 | 122 (69.71) | 61 (69.32) | 61 (70.11) |
| M1 | 10 (5.71) | 3 (3.41) | 7 (8.05) |
| MX+unknown | 42 (24.00) | 24 (27.27) | 19 (21.84) |
| N, n (%) | |||
| N0 | 82 (46.86) | 40 (45.45) | 42 (48.28) |
| N1+N2 | 86 (49.14) | 44 (5.00) | 42 (48.28) |
| N3 | 3 (1.71) | 2 (2.27) | 1 (1.15) |
| NX+unknown | 4 (2.29) | 2 (2.27) | 2 (2.30) |
T, tumor; N, node; M, metastasis. |