
1 资料与方法
1.1 数据来源
1.2 研究对象来源及纳入排除标准
1.3 研究设计
1.4 资料整理
1.5 统计学分析
2 结果
2.1 研究人群的基本特征
表1 2015—2021年宁波市6岁以下儿童一般人口学特征Table 1 Basic demographic characteristics of children under 6 years old in Ningbo City from 2015 to 2021 |
| Characteristics variables | Total (n=1 302 937) | Non-FS children (n=1 290 161) | FS children (n=12 776) | U/χ2 a | P |
| Follow-up/years, M (P25, P75) | 2.83 (1.55, 4.00) | 2.81 (1.55, 4.00) | 3.97 (3.03, 4.84) | 77.0b | < 0.000 1 |
| Gender, n (%) | 414.7 | < 0.000 1 | |||
| Female | 614 075 (47.13) | 609 179 (47.22) | 4 878 (38.21) | ||
| Male | 688 855 (52.87) | 680 957 (52.78) | 7 898 (61.79) | ||
| Birth year, n (%) | 3 721.3 | < 0.000 1 | |||
| 2009 | 52 503 (4.03) | 52 474 (4.07) | 29 (0.23) | ||
| 2010 | 97 372 (7.48) | 97 180 (7.53) | 192 (1.50) | ||
| 2011 | 114 688 (8.80) | 114 165 (8.85) | 523 (4.09) | ||
| 2012 | 127 890 (9.82) | 126 776 (9.83) | 1 114 (8.72) | ||
| 2013 | 123 135 (9.45) | 121 577 (9.42) | 1 558 (12.19) | ||
| 2014 | 139 110 (10.67) | 136 920 (10.61) | 2 190 (17.14) | ||
| 2015 | 124 730 (9.57) | 122 794 (9.52) | 1 936 (15.15) | ||
| 2016 | 135 426 (10.39) | 133 393 (10.34) | 2 033 (15.91) | ||
| 2017 | 124 524 (9.56) | 122 843 (9.52) | 1 681 (13.16) | ||
| 2018 | 103 732 (7.96) | 102 772 (7.97) | 960 (7.51) | ||
| 2019 | 93 662 (7.19) | 93 178 (7.22) | 484 (3.79) | ||
| 2020 | 66 165 (5.08) | 66 089 (5.12) | 76 (0.59) | ||
| City of birth, n (%) | 756.6 | < 0.000 1 | |||
| Ningbo outside | 428 490 (32.88) | 425 742 (33.00) | 2 748 (21.51) | ||
| Ningbo | 873 107 (67.01) | 863 094 (66.90) | 10 013 (78.37) | ||
| Missing | 1 340 (0.10) | 1 325 (0.10) | 15 (0.12) | ||
| Mobility population, n (%) | 167.9 | < 0.000 1 | |||
| No | 972 391 (74.63) | 962 222 (74.58) | 10 169 (79.59) | ||
| Yes | 330 546 (25.37) | 327 939 (25.42) | 2 607 (20.41) | ||
| Location, n (%) | 95.0 | < 0.000 1 | |||
| Urban | 763 701 (58.61) | 755 716 (58.58) | 7 985 (62.5) | ||
| Urban-rural fringe | 309 936 (23.79) | 307 319 (23.82) | 2 617 (20.48) | ||
| Rural | 227 820 (17.49) | 225 661 (17.49) | 2 159 (16.90) | ||
| Missing | 1 480 (0.11) | 1 465 (0.11) | 15 (0.12) | ||
| District, n (%) | 903.4 | < 0.000 1 | |||
| Yuyao | 171 664 (13.17) | 170 314 (13.2) | 1 350 (10.57) | ||
| Beilun | 128 216 (9.84) | 126 985 (9.84) | 1 231 (9.64) | ||
| Fenghua | 66 982 (5.14) | 65 952 (5.11) | 1 030 (8.06) | ||
| Ninghai | 98 411 (7.55) | 97 627 (7.57) | 784 (6.14) | ||
| Cixi | 251 111 (19.27) | 249 186 (19.31) | 1 925 (15.07) | ||
| Jiangbei | 69 471 (5.33) | 68 738 (5.33) | 733 (5.74) | ||
| Haishu | 90 916 (6.98) | 89 920 (6.97) | 996 (7.8) | ||
| Xiangshan | 70 338 (5.40) | 69 900 (5.42) | 438 (3.43) | ||
| Yinzhou | 271 894 (20.87) | 268 861 (20.84) | 3 033 (23.74) | ||
| Zhenhai | 77 081 (5.92) | 75 858 (5.88) | 1 223 (9.57) | ||
| Missing | 6 853 (0.53) | 6 820 (0.53) | 33 (0.26) |
a, The value is the testing statistics for the comparison of characteristic variables between the non-FS group and the FS group. b, The value is the U statistics of Wilcoxon rank-sum test, and the others are χ2 values. FS, febrile seizure. |
2.2 FS患儿的基本特征
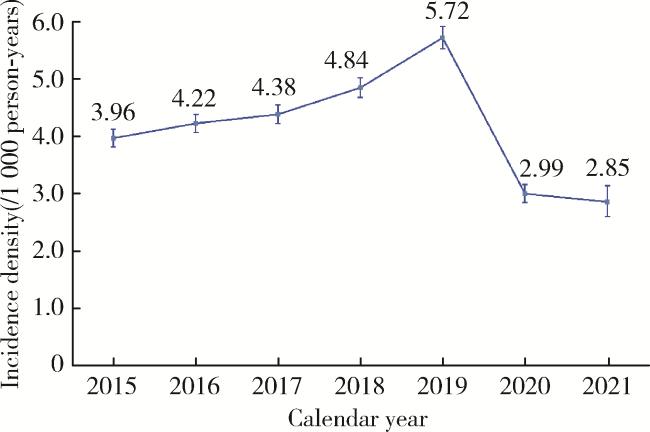
2.3 FS的发病密度
表2 2015—2021年宁波市6岁以下儿童FS发病密度的人群分布特征Table 2 Population characteristics of the FS incidence density among children under 6 years old in Ningbo City from 2015 to 2021 |
| Variable | Number of FS episodes, n (%)a | Follow-up(/person-years) | Incidence density (95%CI)(/1 000 person-years) |
| Total | 16 326 (100.00) | 3 765 767.35 | 4.34 (4.27-4.40) |
| Gender | |||
| Female | 6 134 (37.57) | 1 776 810.55 | 3.24 (3.13-3.35) |
| Male | 10 192 (62.43) | 1 988 941.25 | 4.75 (4.67-4.84) |
| Birth city | |||
| Ningbo outside | 3 361 (21.59) | 1 038 704.37 | 3.24 (3.13-3.35) |
| Ningbo | 12 944 (79.28) | 2 722 824.45 | 4.75 (4.67-4.84) |
| Mobility population | |||
| No | 13 072 (80.06) | 2 796 648.95 | 4.67 (4.59-4.76) |
| Yes | 3 254 (19.94) | 969 118.40 | 3.36 (3.24-3.48) |
a, The washout period of 7 days was used to identify the FS episode. FS, febrile seizure; CI, confidence interval. |
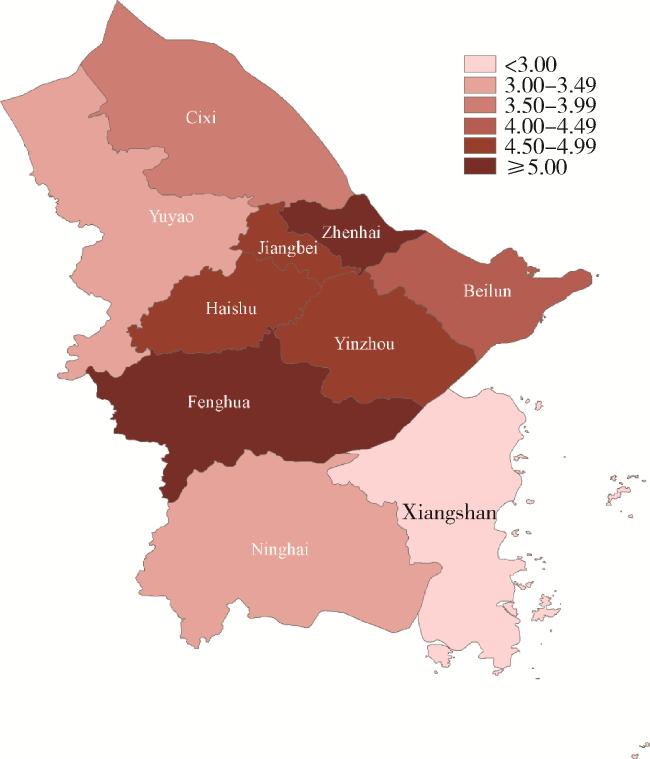
2.4 FS发病的地区分布
表3 2015—2021年宁波市6岁以下儿童FS发病密度的地区分布特征Table 3 Regional distribution characteristics of the FS incidence density among children under 6 years old in Ningbo City from 2015 to 2021 |
| Location | Number of FS episodes, n (%) | Follow-up(/person-years) | Incidence density (95%CI)(/1 000 person-years) |
| Urban | 10 329 (63.33) | 2 224 472.86 | 4.64 (4.55-4.73) |
| Urban-rural fringe | 3 289 (20.16) | 891 344.26 | 3.69 (3.57-3.82) |
| Rural | 2 692 (16.51) | 646 612.06 | 4.16 (4.01-4.32) |
FS, febrile seizure; CI, confidence interval. |