
计算机辅助设计/计算机辅助制作(computer-aided design and computer- aided manufacturing, CAD/ CAM)技术的出现,改变了传统修复体制作工艺流程复杂、设备繁多等缺点,已逐渐发展成为传统修复体制作技术的替代技术[1]。作为CAD/CAM系统的第一步,高精度的数据获取是修复体成功的前提,其准确度直接决定着修复体的质量[2-5]。获取数据的途径有间接法和直接法,间接法依赖于传统印模技术,通过扫描石膏模型或印模获取三维数据;而直接法则不需制取印模,直接在患者口腔内进行扫描,获取三维数据,也称为口内扫描。口内扫描获取数字印模可以避免制取印模时患者的不适感,相比模型扫描,其能减少制取印模、模型制作等人为操作对预备体和修复体三维数据精确度的影响[6-7],但同时也受到患者口腔空间狭小、潮湿、光线不足等限制,加之呼吸和轻微的抖动,均会对扫描数据的精度造成一定程度的影响,从而影响修复体的精度和质量。因此,数字印模准确度是否能达到临床应用的要求,是目前很多研究关注的焦点。
修复体的适合性直接受印模准确度的影响[4],其分为内部适合性和边缘适合性,通过对内部间隙(internal gap,IG)及边缘间隙(marginal gap,MG)的测量得以体现。内部间隙为修复体内表面到预备体轴面外表面的垂直距离;边缘间隙为边缘处的垂直距离,包括预备体边缘至修复体内表面的垂直距离和修复体边缘至预备体边缘的垂直距离[8]。良好的边缘适合性是保证牙周组织健康的必要条件,边缘间隙过大会导致粘接剂溶解、菌斑堆积、牙龈炎症[9-10]、龈沟液流量增加[11],严重者甚至出现牙槽骨丧失,出现继发龋、边缘着色、边缘微渗漏增加[12]等。修复体内部适合性则与全瓷修复体长期效果密切相关[13],粘接间隙过厚会影响修复体抗折强度并导致容易出现脱粘接。本研究通过分析数字印模技术制作的氧化锆和二硅酸锂增强玻璃陶瓷高嵌体的边缘及内部适合性,评价直接法及间接法数字印模技术的准确度,为临床应用提供参考。
1 材料与方法
1.1 材料与设备
实验用材料和设备有:仿头模(日进株式会社,日本)、上下颌牙列模型(日进株式会社,日本)、36牙位人工树脂牙(日进株式会社,日本)、聚醚硅橡胶印模材(Impregum Penta Soft,3M公司,美国)、加成型硅橡胶印模材(Aquasil Ultra XLV,Densply公司,德国)、牙科Ⅳ型石膏(Heraeus公司,德国)、氧化锆陶瓷材料(爱尔创,中国)、二硅酸锂增强玻璃陶瓷材料(锂瓷,爱尔创,中国)、口内扫描仪(CEREC Omnicam,Sirona公司,德国,精度20 μm)、模型扫描仪(D2000,3Shape公司,丹麦,精度5 μm)、体式显微镜(MZ 16A,莱卡,瑞士)。
1.2 试样分组与制作
36牙位人工树脂牙48颗,体外完成人工牙标准近中牙合远中(mesial-occlusal-distal,MOD)高嵌体牙体预备(图 1),显微镜下检查预备质量。将制备好的人工牙随机分为4组(每组12颗):A组为直接法数字印模+氧化锆修复,B组为直接法数字印模+二硅酸锂增强玻璃陶瓷修复,C组为间接法数字印模+氧化锆修复,D组为间接法数字印模+二硅酸锂增强玻璃陶瓷修复。

仿头模固定于牙科治疗椅,将标准人工牙列模型固定于仿头模内,各组人工牙预备体依次置于人工牙列内相应位置。A、B组使用口内扫描仪获取36牙位数字印模,C、D组使用成品托盘,聚醚硅橡胶制取牙列印模,灌注石膏模型后再使用模型扫描仪扫描石膏模型。所有扫描操作均由同一研究者完成。
4组均使用数字化设计软件(3Shape Dental System,3Shape公司,丹麦)完成高嵌体设计,设置粘接间隙为50 μm,由加工部门使用数字化切削方式完成高嵌体制作:A、C组使用氧化锆材料,B、D组使用二硅酸锂增强玻璃陶瓷材料。使用三维配准方法评价4组制作完成的高嵌体边缘适合性及内部适合性。
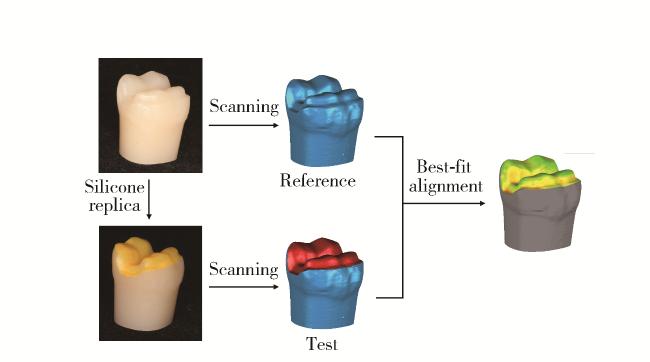
1.3 三维配准方法评价边缘适合性与内部适合性

1.4 统计学方法
使用SPSS 20.0软件进行统计分析,检验水准为双侧α=0.05。使用S-W检验法对数据进行正态性检验,各组数据服从正态分布,用均数±标准差表示。双因素方差分析分别比较不同取模方式、制作材料对内部间隙的影响,多因素方差分析结合最小显著差异(least significant difference, LSD)多重比较分析不同取模方式、制作材料、位置对边缘间隙的影响。
2 结果
2.1 不同数字印模法制作的高嵌体内部适合性和边缘适合性
表1 各组高嵌体内部及边缘间隙值Table 1 Internal and marginal gap values for each group |
| Group | Method | Material | Internal gap values/μm | Marginal gap values/μm |
| A (n=12) | Direct | Zirconia | 135.54±14.69 | 144.30±20.44 |
| B (n=12) | Direct | Ceramic | 124.16±22.04 | 135.53±23.44 |
| C (n=12) | Indirect | Zirconia | 103.77±13.61 | 104.55±19.02 |
| D (n=12) | Indirect | Ceramic | 108.49±17.83 | 122.78±23.36 |
Data are expressed as $\bar x \pm s$. A,digital impression+zirconia;B,digital impression+ lithium disilicate glass-ceramic;C,conventional impression with model scanner+zirconia;D,conventional impression with model scanner+ lithium disilicate glass-ceramic. |
表2 内部间隙双因素方差分析统计结果Table 2 Two-way ANOVA analysis of internal gap |
| Source | Type Ⅲ sum of squares | df | Mean square | F | P |
| Corrected model | 5 251.241a | 2 | 2 625.621 | 8.717 | 0.001 |
| Intercept | 515 841.350 | 1 | 515 841.350 | 1 712.556 | < 0.001 |
| Method | 5 211.009 | 1 | 5 211.009 | 17.300 | < 0.001 |
| Material | 40.232 | 1 | 40.232 | 0.134 | 0.717 |
a, R2=0.332, adjusted R2=0.294. |
表3 边缘间隙多因素方差分析统计结果Table 3 Three-way ANOVA analysis of marginal gap |
| Source | Type Ⅲ sum of squares | df | Mean square | F | P |
| Corrected model | 150 406.021a | 15 | 10 027.068 | 9.374 | < 0.001 |
| Intercept | 2 532 324.909 | 1 | 2 532 324.909 | 2 367.339 | < 0.001 |
| Method | 13 937.982 | 1 | 13 937.982 | 13.030 | < 0.001 |
| Position | 84 163.215 | 3 | 28 054.405 | 26.227 | < 0.001 |
| Material | 3 819.499 | 1 | 3 819.499 | 3.571 | 0.061 |
| Method×Position | 12 588.477 | 3 | 4 196.159 | 3.923 | 0.010 |
| Method×Material | 3 140.300 | 1 | 3 140.300 | 2.936 | 0.089 |
| Position×Material | 14 902.929 | 3 | 4 967.643 | 4.644 | 0.004 |
| Method×Position×Material | 9 945.476 | 3 | 3 315.159 | 3.099 | 0.029 |
a, R2=0.508, adjusted R2=0.454. |
2.2 不同制作材料对高嵌体边缘及内部适合性的影响
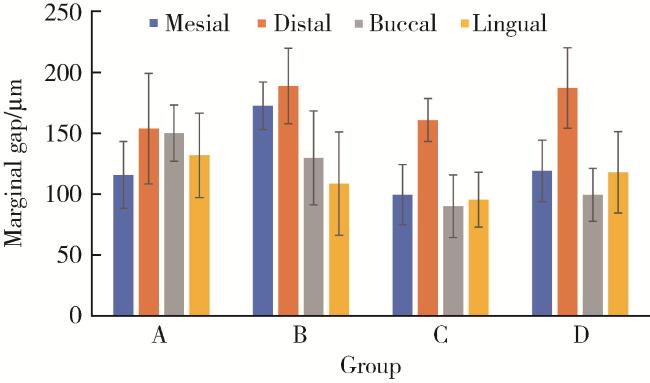
2.3 不同部位的边缘间隙值
2.4 不同取模方式、制作材料及位置对边缘间隙值的影响
从表 3可见,不同取模方式、制作材料及位置对边缘间隙值的影响上存在三因素交互作用(P < 0.05),不同取模方式与位置、不同制作材料与位置对边缘间隙值的影响存在两因素交互作用(P < 0.05)。
3 讨论
依赖于传统印模技术及模型制作的间接法数字印模会受到模型精确度的影响,而直接法数字印模是通过扫描直接获得口内组织的三维图像,理论上应该可以避免传统印模模型技术造成的误差,减少人为操作对最终修复体产生的影响[7]。但本研究却得出基于间接法数字印模制作的高嵌体边缘适合性和内部适合性均优于直接法数字印模的结论,分析其原因可能有以下两个方面。其一,本研究使用仿头模模拟了口腔内有限的扫描空间,在进行口内扫描时,扫描头自由度会受到模拟口腔的限制;有研究表明,扫描方向与被扫描表面的垂线夹角大于60°时,扫描精度下降[15]。其二,高嵌体复杂的洞型形态也会对扫描精度造成影响,比如:由于深窝洞的存在,扫描光线被洞壁阻挡,从而影响捕获图像的质量和清晰度[16];复杂洞型会因被扫描表面曲率的突然变化,导致更大的扫描偏差[17];邻牙的遮挡也会使入射光线光强下降,同时口内扫描仪工作头接收的反射、散射光线光强均下降,从而导致扫描精度下降[18]。
良好的边缘适合性及内部适合性对修复体长期效果至关重要,但目前对于修复体适合性评价标准的争议很多[19]。边缘适合性方面,多数文献参考的是Mclean等[20]1971年提出的标准,即边缘间隙临床可接受范围在120 μm以内。但有研究认为,嵌体的边缘适合性要求更高,边缘间隙需控制在100 μm以内[21];Bindl等[22]则认为树脂粘接剂厚度达到500 μm时,仍可以抵抗边缘微渗漏。因此,目前尚无对于嵌体/高嵌体边缘适合性试验统一的参考指标。本研究结果显示,各组高嵌体的边缘间隙值在100~150 μm,尽管可以达到临床要求,但数值略大,尤其是直接法数字印模组,分析其原因可能与高嵌体这一修复方式有关。有研究表明修复体类型会影响边缘间隙,与全冠相比,嵌体/高嵌体的预备体洞型复杂,边缘线也更长,在设置相同边缘间隙参数的条件下,使用同种切削设备制作出的牙冠边缘间隙最小,而高嵌体边缘间隙最大[18]。高嵌体复杂的洞型会影响口内扫描、边缘线识别、切削加工以及修复体就位[23],从而导致边缘间隙增大。关于内部适应性,目前同样没有科学依据支持某一客观标准。Kim等[19]和Colpani等[24]认为70~120 μm是临床可接受范围,也有研究表明内部间隙在50~100 μm时树脂水门汀的表现最佳[25-27]。Bosch等[28]指出,加工过程会引起内部间隙变大,但内部间隙在150 μm内均是临床可以接受的。本研究中,在模拟口腔取模环境下,虽然结果表明基于间接法数字印模技术制作陶瓷高嵌体的边缘适合性均优于直接法,但各组内部间隙值在100~140 μm,基于上述研究,可认为基于直接法和间接法数字印模制作的高嵌体内部适合性均能够达到临床标准。
本研究进一步对各组高嵌体颊侧、舌侧、近中及远中4个位置的边缘间隙值进行了分析,结果表明远中部位边缘间隙值最大。虽然直接法和间接法数字印模技术获取数字模型的方法不同,但都出现了远中边缘间隙值大的情况。分析其原因,直接法数字印模技术的质量受扫描角度、洞型及邻牙光线遮挡的影响,而以上因素对远中边缘区域影响程度更大,因此造成了更大的边缘间隙值。而间接法数字印模技术,远中区域边缘间隙值增大则主要与印模制取过程中印模材料的形变有关。Akalin等[29]的研究表明,取出印模时施加力的大小和持续时间对于弹性印模材料的永久变形十分重要。龈端区域由于邻牙的存在,聚醚印模材料厚度较薄,当印模从牙弓上取出时,印模材料较薄区域变形的风险更大[3, 30]。因此,传统印模制取过程中,龈端区域更容易发生变形,尤其是远中,这就导致了基于间接法数字印模技术制作的高嵌体远中部位边缘间隙值更大的结果。
氧化锆及二硅酸锂增强玻璃陶瓷是临床最为常用的CAD/CAM陶瓷类材料,两种材料本身性质不同,且其切削过程有明显区别,氧化锆陶瓷材料是干切削,而二硅酸锂增强玻璃陶瓷是湿切削[31]。本研究对比两种材料制作高嵌体的适合性,结果显示两种不同材料对高嵌体适合性没有影响。Duqum等[31]的研究认为二硅酸锂增强玻璃陶瓷全冠的边缘适合性优于氧化锆陶瓷,而Francesco等[32]的研究显示两种材料制作的CAD/CAM全冠的边缘间隙值没有显著差异,Fuzzi等[33]则认为氧化锆陶瓷制作的羽状边缘全冠的边缘间隙明显小于二硅酸锂增强玻璃陶瓷,可见以往的研究并未得出一致的结论。本研究表明,不论是氧化锆或是二硅酸锂增强玻璃陶瓷,在进行CAD/CAM高嵌体制作时,均可以达到较好的边缘适合性与内部适合性,两种材料不存在明显差别。
统计分析表明,不同取模方式、制作材料及位置对边缘间隙值的影响存在三因素交互作用(P < 0.05),不同取模方式与位置、不同制作材料与位置对边缘间隙值的影响存在两因素交互作用(P < 0.05)。由于本研究样本量的局限性,未来需要通过控制变量、增加样本量等方法,对本研究发现的交互作用做进一步深入探索和分析。
综上所述,基于间接法数字印模技术制作的高嵌体的内部及边缘适合性均优于直接法;氧化锆及二硅酸锂增强玻璃陶瓷两种修复材料对高嵌体适合性没有明显影响。本研究虽然使用仿头模模拟了口腔的有限操作空间,但并未模拟真实口腔环境中的唾液、血液、患者微动等干扰因素,因此,还需要进一步的研究来证实这些因素的影响。