
1 资料与方法
1.1 数据来源与研究队列
1.2 研究结局与定义
1.3 随访
1.4 统计学分析
2 结果
2.1 研究队列的基线特征
表1 倾向性评分匹配前后PN组和RN组患者的基线资料Table 1 Baseline of patients undergoing PN and RN before and after propensity score matching |
| Items | Before propensity score matching | P value | After propensity score matching | Pvalue | ||
| PN (n = 33) | RN (n = 394) | PN (n = 33) | RN (n = 33) | |||
| Age/years, n(%) | 0.879 | >0.999 | ||||
| <65 | 18 (54.5) | 203 (51.5) | 18 (54.5) | 18 (54.5) | ||
| ≥ 65 | 15 (45.5) | 191 (48.5) | 15 (45.5) | 15 (45.5) | ||
| Gender, n(%) | 0.164 | >0.999 | ||||
| Male | 26 (78.8) | 257 (65.2) | 26 (78.8) | 27 (81.8) | ||
| Female | 7 (21.2) | 137 (34.8) | 7 (21.2) | 6 (18.2) | ||
| Laterality, n(%) | >0.999 | 0.460 | ||||
| Left | 18 (54.5) | 215 (54.6) | 18 (54.5) | 14 (42.4) | ||
| Right | 15 (45.5) | 179 (45.4) | 15 (45.5) | 19 (57.6) | ||
| ASA level, n(%) | 0.146 | 0.920 | ||||
| 1 | 6 (18.2) | 82 (20.8) | 6 (18.2) | 7 (21.2) | ||
| 2 | 25 (75.8) | 291 (73.9) | 25 (75.8) | 23 (69.7) | ||
| 3 | 1 (3.0) | 20 (5.1) | 1 (3.0) | 2 (6.1) | ||
| 4 | 1 (3.0) | 1 (0.3) | 1 (3.0) | 1 (3.0) | ||
| Comorbidity, n(%) | 14 (42.4) | 166 (42.1) | >0.999 | 14 (42.4) | 17 (51.5) | 0.622 |
| Hypertension | 14 (42.4) | 141 (35.8) | 14 (42.4) | 14 (42.4) | ||
| Diabetes | 6 (18.2) | 52 (13.2) | 6 (18.2) | 9 (27.3) | ||
| CHD | 1 (3.0) | 21 (5.3) | 1 (3.0) | 2 (6.1) | ||
| CVD | 2 (6.1) | 21 (5.3) | 2 (6.1) | 1 (3.0) | ||
| Surgery history | 12 (36.4) | 104 (26.4) | 12 (36.4) | 11 (33.3) | ||
| Tumor diameter /cm, n(%) | <0.001 | >0.999 | ||||
| ≤4 | 26 (78.8) | 61 (15.5) | 26 (78.8) | 26 (78.8) | ||
| >4, ≤7 | 7 (21.2) | 202 (51.3) | 7 (21.2) | 7 (21.2) | ||
| >7 | 0 (0) | 131 (33.2) | 0 (0) | 0 (0) | ||
| eGFR/ [mL/(min·1.73 m2)], M (P25, P75) | 88.9 (64.0, 99.3) | 86.7 (72.6, 97.6) | 0.956 | 88.9 (64.0, 99.3) | 89.3 (79.6, 97.7) | 0.830 |
| Renal vein thrombosis, n(%) | 0 (0) | 60 (15.2) | 0.031 | 0 (0) | 0 (0) | >0.999 |
| PFI, n(%) | 15 (45.5) | 60 (15.2) | <0.001 | 15 (45.5) | 16 (48.5) | >0.999 |
| RSI, n(%) | 7 (21.2) | 290 (73.6) | <0.001 | 10 (30.3) | 12 (36.4) | 0.794 |
| Segmental renal vein extension, n(%) | 14 (42.4) | 82 (20.8) | 0.008 | 14 (42.4) | 15 (45.5) | >0.999 |
| Histology, n(%) | >0.999 | >0.999 | ||||
| ccRCC | 29 (87.9) | 346 (87.8) | 29 (87.9) | 29 (87.9) | ||
| nccRCC | 4 (12.1) | 48 (12.2) | 4 (12.1) | 4 (12.1) | ||
| Fuhrman grading, n(%) | 0.072 | 0.782 | ||||
| Ⅰ-Ⅱ | 25 (75.8) | 229 (58.1) | 25 (75.8) | 23 (69.7) | ||
| Ⅲ-Ⅳ | 8 (24.2) | 165 (41.9) | 8 (24.2) | 10 (30.3) | ||
| Sarcomatoid differentiation, n(%) | 0 (0) | 9 (2.3) | >0.999 | 0 (0) | 0 (0) | >0.999 |
PN, partial nephrectomy; RN, radical nephrectomy; ASA, American Society of Anesthesiologists; eGFR, estimated glomerular filtration rate; PFI, perirenal fat invasion; RSI, renal sinus invasion; ccRCC, clear cell renal cell carcinoma; nccRCC, non-clear cell renal cell carcinoma. |
2.2 围术期结局
表2 匹配后队列中PN组和RN组的围术期结局比较Table 2 Comparison of perioperative outcomes of PN group and RN group in the matched cohort |
| Items | PN (n=33) | RN (n=33) | P value |
| Nephrectomy techniques, n(%) | 0.672 | ||
| Laparoscopic nephrectomy | 29 (87.9) | 31 (93.9) | |
| Robot-assisted laparoscopic nephrectomy | 4 (12.1) | 2 (6.1) | |
| Surgical approach, n(%) | 0.622 | ||
| Retroperitoneal | 15 (45.5) | 18 (54.5) | |
| Transperitoneal | 18 (54.5) | 15 (45.5) | |
| Open conversion, n(%) | 1 (3.0) | 3 (9.1) | 0.613 |
| Operative time/min, ${\bar x}$±s | 159.0±57.8 | 148.0±70.8 | 0.281 |
| Blood loss/mL, M (P25, P75) | 50.0 (20, 100) | 20.0 (20, 50) | 0.372 |
| Postoperative eGFR [mL/(min·1.73m2], M (P25, P75) | 76.9 (55.4, 87.3) | 61.7 (56.8, 73.5) | 0.016 |
| Complications, n(%) | 6 (18.2) | 8 (24.2) | 0.763 |
| PSM, n(%) | 1 (3.3) | 0 (0) | >0.999 |
| Postoperative hospital stays/d,${\bar x}$±s | 6.1±2.4 | 5.9±2.1 | 0.818 |
PN, partial nephrectomy; RN, radical nephrectomy; eGFR, estimated glomerular filtration rate; PSM, positive surgical margins. |
2.3 肿瘤学结局
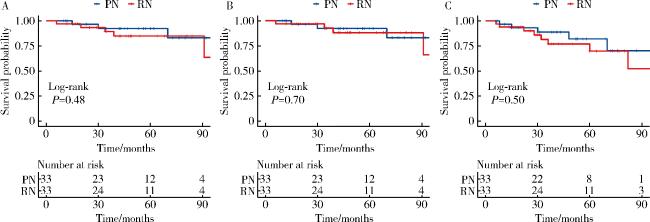
图1 匹配后队列中PN组和RN组的肿瘤学结局Figure 1 Oncological outcomes of PN group and RN group in the matched cohort A, overall survival; B, cancer-specific survival; C, disease-free survival of patients with pT3a stage renal cell carcinoma in the matched cohort. PN, partial nephrectomy; RN, radical nephrectomy; pT3a, pathological T3a. |
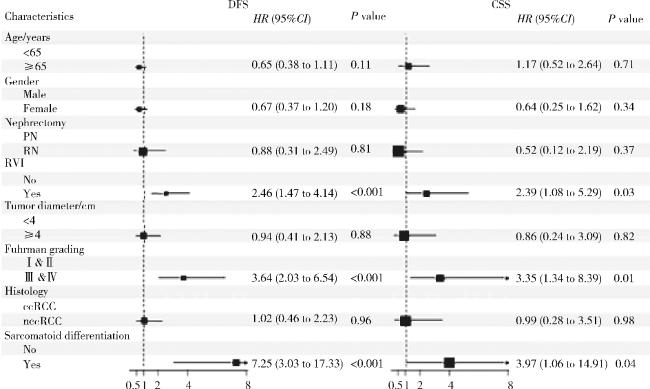
2.4 pT3a RCC的预后因素分析
图2 pT3a RCC患者DFS和CSS的多因素Cox回归分析Figure 2 Multivariate Cox regression analysis of DFS and CSS in patients with pT3a RCC DFS, disease-free survival; CSS, cancer-specific survival; PN, partial nephrectomy; RN, radical nephrectomy; RVI, renal vein invasion; ccRCC, clear cell renal cell carcinoma; nccRCC, non-clear cell renal cell carcinoma; pT3a, pathological T3a; RCC, renal cell carcinoma. |