
1 资料与方法
1.1 数据来源
研究数据来源于北京大学肿瘤医院电子病历系统,提取2018—2020年就诊患者的基本信息与就诊记录,包括患者编号、医保类型(本地/外地)、性别、出生日期、就诊类型(门诊/住院)、就诊科室、门诊患者就诊日期、住院患者入(出)院日期、门诊处方记录、重症监护室(intensive care unit,ICU)诊疗记录、手术记录、门诊/住院费用。数据提取方案经北京大学肿瘤医院医学伦理委员会审批通过(审批号:2022KT11)。研究中所使用的患者数据均经过脱敏处理,数据提取过程由该医院信息科工作人员进行,尽可能地控制了泄露患者隐私的风险。
1.2 患者纳入和排除标准
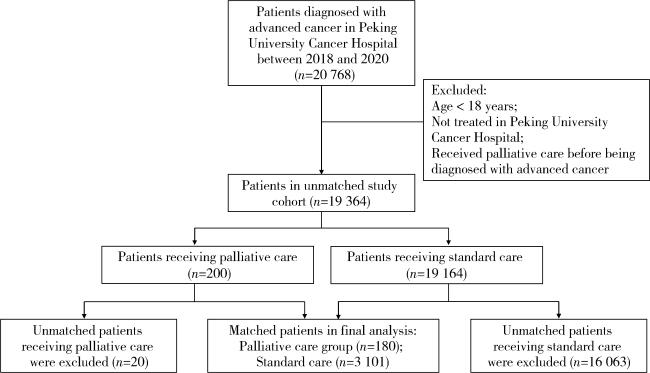
纳入标准:确诊时年龄≥18岁且诊断为晚期或Ⅳ期恶性肿瘤。排除标准:仅有非治疗性干预记录(超声检查等),以及在晚期癌症确诊前已接受姑息治疗的患者。
1.3 患者分组与匹配
1.4 患者随访期与暴露期的确定
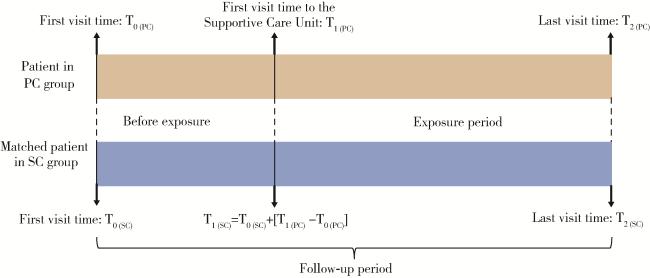
本研究涉及到如下3个关键时间点:患者首次就诊时间、暴露开始时间及患者末次就诊时间。其中,首次就诊时间为患者就诊记录中首次被记录为晚期癌症的日期。姑息治疗组的暴露开始时间为患者首次就诊于支持治疗科的日期;对于常规治疗组患者,本研究分配了一个假暴露开始时间,即首次就诊时间加上匹配到的姑息治疗组患者的暴露前时长。首次就诊时间至末次就诊时间为随访期,首次就诊时间至暴露开始时间为暴露前,暴露开始时间到末次就诊时间为暴露期。具体时间段划分见图 2。
1.5 主要结局指标
1.6 统计学方法
2 结果
2.1 患者特征
姑息治疗组与常规治疗组患者的基本特征以及L1值见表 1。最终共筛选出180例姑息治疗组患者与3 101例常规治疗组患者纳入本研究,两组患者的中位随访时长分别为446.5 d和402.0 d(P>0.05),CEM匹配后两组患者之间各协变量的L1值均<0.1。
表1 姑息治疗组与常规治疗组患者的基本特征Table 1 Characteristics of patients in the palliative care group and the standard care group |
| Items | Palliative care group (n=180) | Standard care group (n=3 101) | L1 |
| Sex | <0.01 | ||
| Female | 55 (30.6) | 1 198 (38.6) | |
| Male | 125 (69.4) | 1 903 (61.4) | |
| Age/years | 0.013 | ||
| 18-44 | 8 (4.4) | 54 (1.7) | |
| 45-64 | 75 (41.8) | 1 308 (42.2) | |
| ≥65 | 97 (53.9) | 1 739 (56.1) | |
| Location of medical insurance | 0.046 | ||
| Local | 42 (23.3) | 578 (18.6) | |
| Non-local | 138 (76.7) | 2 523 (81.4) | |
| Year of diagnosis | 0.072 | ||
| 2011-2015 | 13 (7.2) | 30 (1.0) | |
| 2016-2020 | 167 (92.8) | 3 071 (99.0) | |
| Cancer site | 0.044 | ||
| Digestive system | 80 (44.4) | 984 (31.7) | |
| Respiratory system | 19 (10.6) | 242 (7.8) | |
| Genital system | 1 (0.6) | 3 (0.1) | |
| Hematologic system | 1 (0.6) | 259 (8.4) | |
| Breast | 5 (2.8) | 13 (0.4) | |
| Head and neck | 6 (3.3) | 7 (0.2) | |
| Other sites | 6 (3.3) | 9 (0.3) | |
| Not specified | 62 (34.4) | 1 584 (51.1) |
Data are expressed as n(%). L1, multivariate imbalance measure. |
2.2 暴露前后两组患者阿片类药物使用量对比
暴露前后姑息治疗组和常规治疗组患者主要结局指标对比见表 2。暴露前,姑息治疗组患者阿片类药物月均使用量显著高于常规治疗组(0.3 DDD/人月vs. 0.1 DDD/人月,P < 0.01);姑息治疗组患者接受姑息治疗后,阿片类药物月均使用量相较姑息治疗前显著增加(0.7 DDD/人月vs. 0.3 DDD/人月,P < 0.01),且与常规治疗组间差异进一步增大(0.7 DDD/人月vs. 0.1 DDD/人月,P < 0.01)。
表2 暴露前后两组患者各结局指标对比Table 2 Comparison of each outcome in the two groups before and after exposure |
| Outcomes | Before exposure | After exposure | |||||
| Palliative care group | Standard care group | P | Palliative care group | Standard care group | P | ||
| Drug use | |||||||
| Average monthly opioid consumption/DDD per person-month | 0.3 | 0.1 | <0.01 | 0.7* | 0.1 | <0.01 | |
| Medical service utilization | |||||||
| Hospital rate/% | 100.0 | 99.8 | 0.555 | 48.9* | 74.3 | <0.01 | |
| ICU rate/% | 6.7 | 2.3 | <0.01 | 1.1* | 1.6 | 0.634 | |
| Operation rate/% | 25.6 | 15.1 | <0.01 | 3.9* | 8.8 | <0.01 | |
| Medical expenditure | |||||||
| Average monthly total cost/yuan | 20 092.3 | 19 132.8 | 0.725 | 9 719.8 | 8 818.8 | 0.165 | |
*P < 0.01, vs. before exposure. DDD, defined daily dose; ICU, intensive care unit. |
2.3 暴露前后两组患者医疗服务利用对比
2.4 暴露前后两组患者医疗费用对比
暴露前和暴露后,姑息治疗组月均总费用均略高于常规治疗组(暴露前:20 092.3元vs. 19 132.8元,P=0.725; 暴露后:9 719.8元vs. 8 818.8元,P=0.165)。
2.5 姑息治疗对主要结局指标的净影响
排除混杂因素影响后,倍差法计算姑息治疗对患者阿片类药物使用、医疗服务利用和医疗费用的净影响值(表 3),可见姑息治疗显著增加了阿片类药物月均使用量(增加0.3 DDD/人月,P < 0.01),显著降低了住院率、ICU率和手术率(分别降低25.6%、4.9%和14.5%,P均 < 0.01),且未对月均总费用产生显著影响(增加2 208.8元,P=0.316)。
表3 姑息治疗对患者各结局指标的净影响值Table 3 The net effect value of palliative care on each outcome |
| Outcomes | Net effect value | |t| | P |
| Drug use | |||
| Average monthly opioid consumption/DDD per person-month | 0.3 | 4.48 | <0.01 |
| Medical service utilization | |||
| Hospital rate/% | -25.6 | 4.53 | <0.01 |
| ICU rate/% | -4.9 | 3.17 | <0.01 |
| Operation rate/% | -14.5 | 4.02 | <0.01 |
| Medical expenditure | |||
| Average monthly total cost/yuan | 2 208.8 | 1.00 | 0.316 |
DDD, defined daily dose; ICU, intensive care unit. |
3 讨论
本研究通过构建回顾性队列,比较了北京大学肿瘤医院姑息治疗组和常规治疗组患者在暴露前后结局指标差异及姑息治疗组患者结局指标变化,研究发现,与常规治疗相比,姑息治疗显著增加了晚期癌症患者阿片类药物的月均使用量,降低了患者的住院率、ICU率、手术率,且对患者的月均总费用无显著影响。
3.1 姑息治疗可改善晚期癌症患者疼痛管理情况
癌性疼痛是指由癌症本身或癌症治疗引起的疼痛,是晚期癌症患者最常见的症状[20]。癌性疼痛会加重患者的痛苦,甚至严重影响患者的生活质量。王薇[21]的研究指出,我国晚期癌症患者面临着阿片类镇痛药物使用不足的问题,仅有25%的患者疼痛得到效缓解。国内外相关指南均将疼痛管理作为姑息治疗的重要干预措施之一[22-23]。Samuel等[24]分析美国医疗保险数据库的处方数据,发现获得姑息治疗委员会认证的医生会为其患者开具更多的阿片类药物。本研究进一步证明了姑息治疗可以增加患者的阿片类药物使用量,可在一定程度上改善晚期癌症患者阿片类药物使用不足的情况,对缓解晚期癌症患者疼痛、提高患者生命质量具有积极意义。
3.2 姑息治疗可降低晚期癌症患者接受治疗的强度
美国国家综合癌症网络发布的《肿瘤临床实践指南:姑息治疗》中强调,应结合患者自身治疗需求,充分评估抗癌治疗的收益与负担,不应盲目进行高强度的抗癌治疗[23]。本研究发现,与常规治疗组相比,姑息治疗组晚期癌症患者住院率、ICU率、手术率均有所降低,这一结果与国外相关研究一致[25-26]。住院率、ICU率以及手术率常用于表征晚期癌症患者对医疗资源的利用情况及接受治疗的强度[25, 27-28],其数值的降低可在一定程度上说明患者接受治疗的强度降低。高强度治疗可能伴随着严重的副作用和身体负担[29],治疗强度降低有利于提高患者生活品质,让患者更多地享受剩余的生命时光。而且ICU率和手术率的降低还可减少因护理不慎而导致的各种并发症风险[30-31]。此外,舒芳芳等[32]的调查显示,接受治疗性择期手术的成人患者术前焦虑的比例高达83.1%,可见手术率的降低在减少患者生理痛苦的同时,也能减少因手术而产生的心理焦虑。
3.3 姑息治疗对患者医疗费用无显著影响
3.4 研究局限性
本研究有以下四点局限性:(1)将有无支持治疗科就诊记录作为区分姑息治疗组和常规治疗组的唯一依据,分组可能存在一定偏差,国外有研究通过国际疾病分类(international classification of disease, ICD)第9版中的编码V66.7(现已被ICD-10 Z51.5取代)识别接受姑息治疗的患者[33],但本研究中病历缺少类似的明确记录或标识,难以找到更合适的分组依据;(2)药物使用、医疗服务利用与医疗费用一定程度上与患者病情相关,尽管本研究采用广义精确匹配法减小两组患者的差异,但仍可能存在一些未纳入的协变量(比如体力状况评分、器官功能)造成的结果偏倚;(3)本研究中的患者不需要每月定期就诊,研究数据并不是严格的面板数据,无法进行面板数据分析以减少遗漏变量偏差;(4)由于缺失患者的住院医嘱数据,仅纳入患者的门诊处方数据进行分析,可能低估了患者阿片类药物的使用水平,导致药物使用结果的偏倚。
综上,姑息治疗可以增加晚期癌症患者阿片类药物的使用量,改善镇痛药使用不足的情况,同时也会降低住院率、ICU率和手术率,避免潜在过度医疗,且对患者医疗费用无显著影响。将来尚需基于具有全国代表性的样本数据开展姑息治疗成本效益评估,进一步优化管理决策,帮助广大患者及其家庭取得最大获益。