
1 资料与方法
1.1 研究对象
1.2 血清样本的处理
1.3 仪器和分析条件
1.4 数据处理
1.5 统计学方法
1.6 代谢物鉴定和代谢通路分析
2 结果
2.1 患者的一般情况
表1 研究对象的临床和人口统计学特征Table 1 Clinical and demographic characteristics of the study population |
| Clinical and demographic characteristics | pSS with thrombocytopenia (n=32) | pSS without thrombocytopenia (n=30) | P |
| Age/years, $\bar x \pm s$ | 52.84±13.33 | 47.9±11.96 | 0.140 0 |
| Female, n(%) | 31 (96.88) | 29 (93.33) | 0.999 9 |
| Course of disease/years, $\bar x \pm s$ | 5.73±5.15 | 1.65±2.77 | 0.000 2 |
| ESSDAI, $\bar x \pm s$ | 2.59±0.49 | 1.13±0.67 | <0.000 1 |
| Platelet count/(×109/L), $\bar x \pm s$ | 39.72±28.31 | 181±55.23 | <0.000 1 |
pSS, primary Sjögren syndrome; ESSDAI, European Alliance of Associations for Rheumatology (EULAR) Sjögren syndrome disease activity index. |
2.2 pSS伴和不伴血小板减少患者的血清代谢组差异
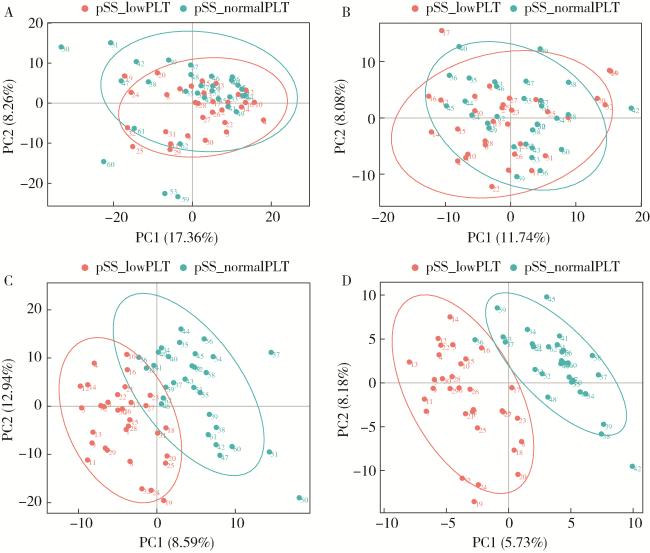
图1 PCA得分图(A、B)和PLS-DA得分图(C、D)Figure 1 PCA score (A, B) and PLS-DA score (C, D) A and B show the PCA score plots of metabolites in positive and negative ion modes; C and D show the PLS-DA score plots of metabolites in positive and negative ion modes. pSS_lowPLT, primary Sjögren syndrome (pSS) with thrombocytopenia group; pSS_normalPLT, pSS without thrombocytopenia group; PC, principal component; PCA, principal component analysis; PLS-DA, partial least squares discriminant analysis. |
2.3 pSS伴和不伴血小板减少患者的血清差异代谢物筛选
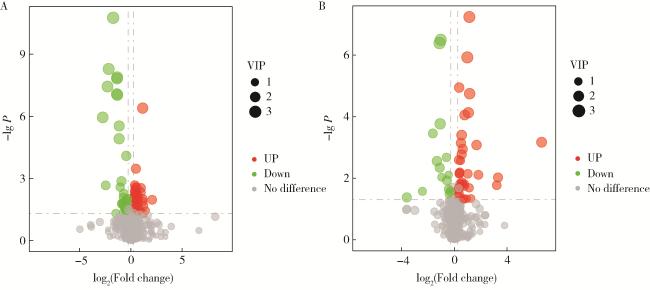
图2 差异代谢物的火山图Figure 2 Volcano plot of differential metabolites A and B show the volcano plots of positive and negative ion patterns in the primary Sjögren syndrome (pSS) with thrombocytopenia and pSS without thrombocytopenia groups. Points in the volcano plot indicate individual metabolites, with red dots representing significantly upregulated metabolites and green dots indicating significantly downregulated ones. The grey dots represent metabolites with no significant difference. The variable importance in the projection (VIP) value is indicated by the size of the points. |
2.4 差异代谢物KEGG通路富集分析
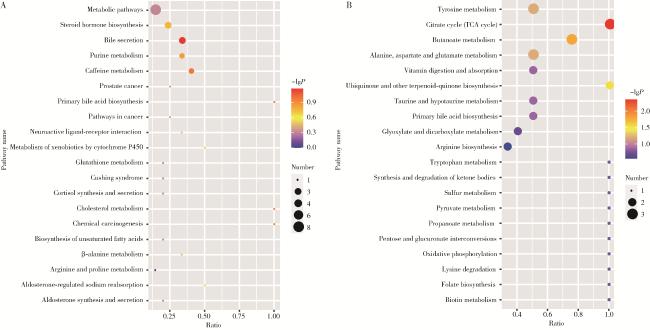
图3 KEGG富集通路气泡图Figure 3 KEGG enrichment pathway bubble plot A and B display the pathway enrichment results of differential metabolites between the primary Sjögren syndrome (pSS) with thrombocytopenia and pSS without thrombocytopenia groups in positive and negative ion modes. Point colors indicate P-values from hypergeometric tests, where smaller values signify more statistically significant results. Point sizes reflect the number of enriched differential metabolites within each pathway, with larger points indicating higher abundance. KEGG, Kyoto Encyclopedia of Genes and Genomes; TCA, tricarboxylic acid. |
2.5 pSS伴血小板减少患者的血清差异代谢物的表达量与血小板计数的关系
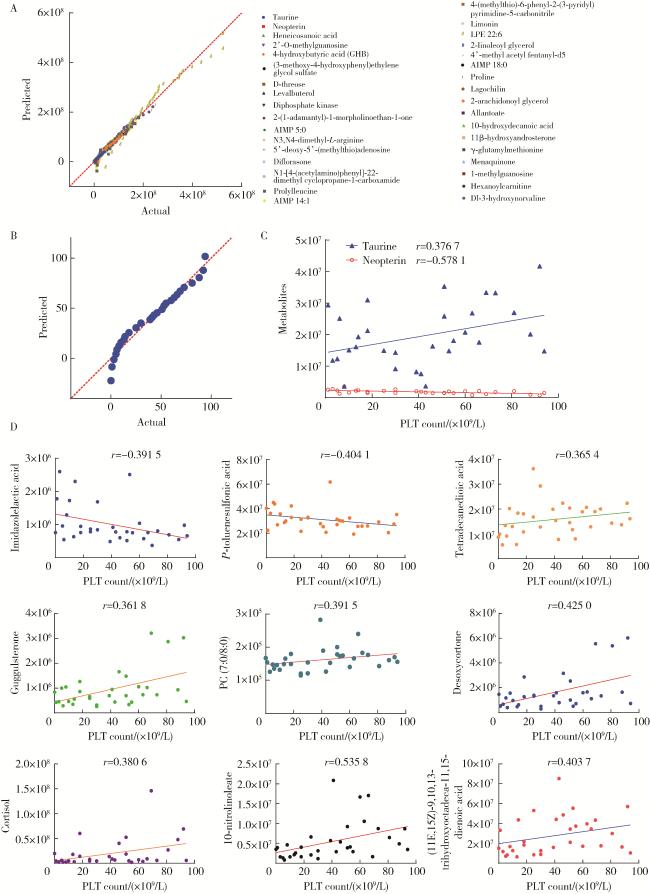


图4 差异代谢物表达量和血小板计数之间的关系Figure 4 Relationship between differential metabolites abundance and platelet count A, normal Q-Q plots of 34 differentially metabolized compounds; B, normal Q-Q plot of platelets, where the x-axis represents actual observed values and the y-axis indicates predicted values. C, Pearson linear correlation plot between 2 differentially metabolized compounds and platelets; D, Spearman linear correlation plot between 9 metabolites and platelets. LPE, lysophosphatidylethanolamine; GHB, γ-hydroxybutyric acid; AIMP, aminoacyl-tRNA synthetase-interacting multifunctional protein; PLT, platelet. |
表2 11种差异代谢物的表达量与血小板计数的关系Table 2 Relationship between expression of 11 differential metabolites and platelet count |
| Differential metabolite | r | P | q | Up/Down | KEGG pathway |
| Taurine | 0.376 7 | 0.036 7 | 0.041 9 | Down | Aurine and hypotaurine metabolism |
| Neopterin | -0.578 1 | 0.000 7 | 0.007 7 | Down | Folate biosynthesis |
| Imidazolelactic acid | -0.391 5 | 0.026 7 | 0.041 9 | Up | |
| P-toluenesulfonic acid | -0.404 1 | 0.021 8 | 0.041 9 | Down | |
| Tetradecanedioic acid | 0.365 4 | 0.039 7 | 0.041 9 | Up | |
| Guggulsterone | 0.361 8 | 0.041 9 | 0.041 9 | Down | |
| Phosphatidylcholine (7 ∶0/8 ∶0) | 0.391 5 | 0.026 7 | 0.041 9 | Down | |
| Desoxycortone | 0.425 0 | 0.015 3 | 0.041 9 | Down | Steroid hormone biosynthesis |
| Cortisol | 0.380 6 | 0.031 6 | 0.041 9 | Down | Steroid hormone biosynthesis |
| 10-nitrolinoleate | 0.535 8 | 0.001 6 | 0.008 8 | Up | |
| (11E, 15Z)-9, 10, 13-trihydroxyoctadeca-11, 15-dienoic acid | 0.403 7 | 0.021 9 | 0.041 9 | Up |
The r-values for taurine and neopterin were analyzed using Pearson correlation, while the remaining correlations were analyzed using Spearman correlation. KEGG, Kyoto Encyclopedia of Genes and Genomes. |