
1 资料与方法
1.1 研究设计与研究对象
1.2 干预措施
1.2.1 CGF的制备
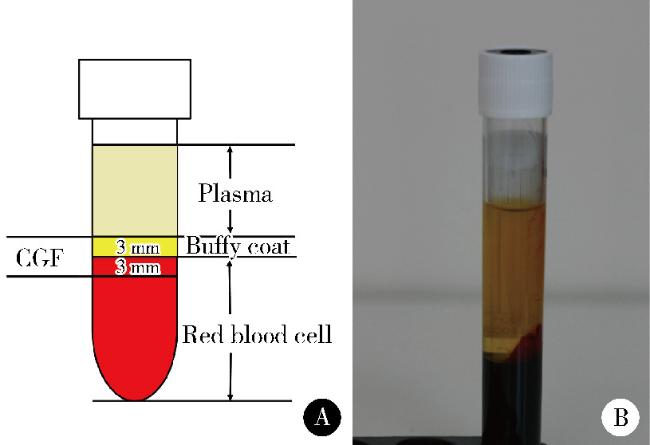
1.2.2 试验组操作过程
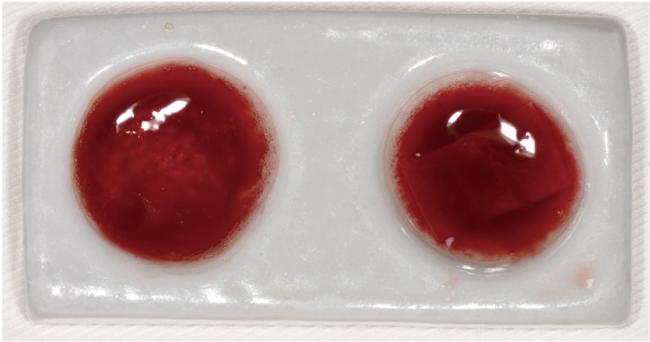
图2 骨粉与可吸收生物膜浸泡于液态CGF内Figure 2 Bone graft and absorbable biological membranes were immersed in CGF Left: Sticky bone; Right: CGF-soaked collagen membrane. CGF, concentrated growth factors. |
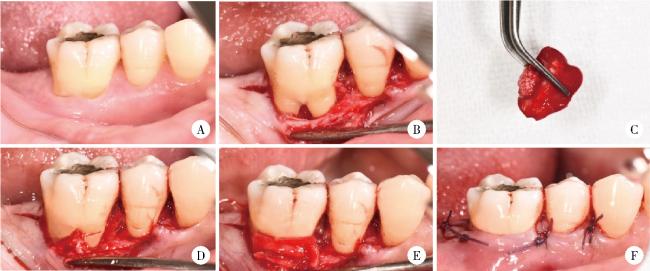
图3 试验组手术过程Figure 3 Surgical procedure of the experimental group A, preoperative view; B, intraoperative finding: Buccal furcation lesion of the right lower first molar; C, concentrated growth factors mixed with bovine porous bone mineral to form sticky bone; D, sticky bone in furcation lesion; E, placement of Bio-Gide absorbable collagen membrane; F, suturing. |
1.2.3 对照组操作过程
1.3 结局指标
1.3.1 主要结局指标
1.3.2 次要结局指标
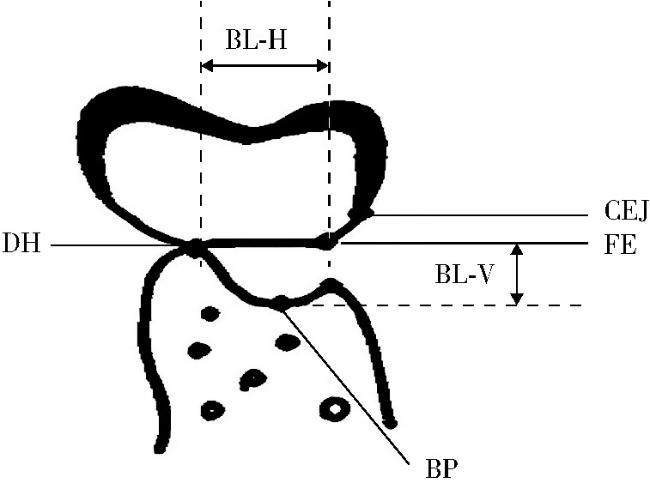
图4 CBCT测量示意图Figure 4 Schematic diagram of marking points of CBCT for furcation involvements CBCT, cone beam CT; CEJ, cementoenamel junction; FE, furcation entrance; BP, bottom of bone pocket; DH, deepest site of horizontal bone loss; BL-H, bone loss in the horizontal direction, the distance from furcation entrance to the deepest site of horizontal bone loss; BL-V, bone loss in the vertical direction, the distance from furcation entrance to the bottom of bone pocket. |
1.4 样本量计算
1.5 随机化与盲法
1.5.1 随机分组方法
1.5.2 盲法的实施
1.6 数据收集与随访
1.6.1 临床数据收集
1.6.2 CBCT数据收集
1.6.3 随访管理
1.7 统计学方法
2 结果
2.1 根分叉病变纳入及入组情况
2.2 术后愈合情况
2.3 基线及术后不同时间点两组临床指标的变化
表1 试验组和对照组基线和术后的出血指数和菌斑指数Table 1 The plaque index and bleeding index at baseline, 6 months and 1 year after surgery |
| Items | GTR+Bone graft+CGF (n=18) | GTR+Bone graft (n=18) |
| Plaque index | ||
| Baseline | 0.7±0.2 | 0.9±0.5 |
| 6 months after surgery | 0.7±0.3 | 1.0±0.6 |
| 1 year after surgery | 0.9±0.4 | 1.1±0.4 |
| Bleeding index | ||
| Baseline | 1.0±0.5 | 1.2±0.6 |
| 6 months after surgery | 1.1±0.6 | 0.9±0.5 |
| 1 year after surgery | 0.8±0.6 | 1.1±0.7 |
Data are expressed as ${\bar x}$±s. GTR, guided tissue regeneration; CGF, concentrated growth factors. |
表2 试验组与对照组基线和术后的临床指标Table 2 Clinical measurements of experimental and control group at baseline, 6 months and 1 year after surgery |
| Items | GTR+Bone graft+CGF (n=18) | GT+Bone graft (n=18) | P value |
| PD/mm | |||
| Baseline | 7.95±2.69 | 7.69±2.74 | 0.965 |
| 6 months after surgery | 3.14±0.95* | 4.09±1.37* | 0.032 |
| 1 year after surgery | 3.20±1.06* | 4.26±1.55* | 0.004 |
| Decrease at 1 year after surgery | 4.75±1.87 | 3.43±1.76 | 0.013 |
| REC/mm | |||
| Baseline | 1.87±0.99 | 1.95±0.96 | 0.245 |
| 6 months after surgery | 0.98±0.58* | 1.10±0.42* | 0.878 |
| 1 year after surgery | 1.07±0.62* | 0.97±0.44* | 0.327 |
| Decrease at 1 year after surgery | 0.80±0.54 | 0.98±0.57 | 0.984 |
| CAL-V/mm | |||
| Baseline | 9.82±2.78 | 9.64±2.53 | 0.052 |
| 6 months after surgery | 4.12±1.83* | 5.19±1.94* | 0.039 |
| 1 year after surgery | 4.27±1.79* | 5.23±1.88* | 0.034 |
| Decrease at 1 year after surgery | 5.55±1.04 | 4.41±1.08 | 0.027 |
| CAL-H/mm | |||
| Baseline | 6.32±2.74 | 6.45±2.87 | 0.977 |
| 6 months after surgery | 2.49±1.03* | 3.44±1.35* | 0.028 |
| 1 year after surgery | 2.43±1.06* | 3.38±1.19* | 0.009 |
| Decrase at 1 year after surgery | 3.89±1.22 | 3.07±1.02 | 0.035 |
Data are expressed as ${\bar x}$±s. *P < 0.01, vs. baseline. GTR, guided tissue regeneration; CGF, concentrated growth factors; PD, probing pocket depth; REC, gingival recession; CAL-V, vertical clinical attachment loss; CAL-H, horizontal clinical attachment loss. |
2.4 基线及术后1年时两组CBCT指标的变化
表3 试验组与对照组基线和术后1年时的CBCT指标Table 3 CBCT data of experimental and control group at baseline and 1 year after surgery |
| Items | GTR+Bone graft+CGF (n=18) | GTR+Bone graft (n=18) | P value |
| BL-V/mm | |||
| Baseline | 7.03±2.86 | 7.35±2.77 | 0.684 |
| 1 year after surgery | 2.98±1.01* | 4.18±1.34* | 0.004 |
| Change of BL-V | 4.05±1.37 | 3.17±1.09 | 0.009 |
| BL-H/mm | |||
| Baseline | 6.94±2.77 | 6.89±2.87 | 0.509 |
| 1 year after surgery | 2.92±1.15* | 3.62±1.09* | 0.012 |
| Change of BL-H | 4.02±1.32 | 3.27±1.08 | 0.027 |
Data are expressed as ${\bar x}$±s. *P < 0.05, vs. baseline. GTR, guided tissue regeneration; CGF, concentrated growth factors; BL-V, bone loss in vertical direction; BL-H, bone loss in horizontal direction. |
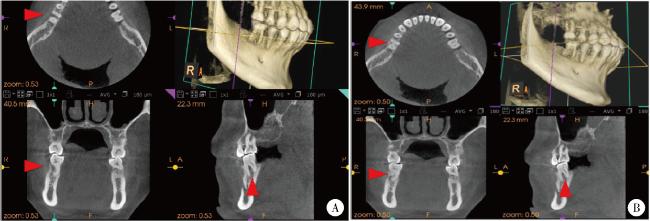


图5 基线和术后1年时试验组CBCT图像Figure 5 CBCT images of experimental group at baseline and 1 year after surgery A, baseline CBCT (the red arrow indicates the buccal furcation lesion of the right lower first molar); B, 1-year post-surgery CBCT (the red arrow indicates the radiographic bone filling condition of the buccal buccal furcation lesion of the right mandibular first molar). CBCT, cone beam CT. |