
1 资料与方法
1.1 研究设计和研究对象
1.2 个体环境温度及其他环境因素暴露监测
1.3 健康测量
1.4 统计学分析
1.4.1 描述性分析
1.4.2 个体温度暴露与睡眠期间SpO2和氧去饱和风险的关联分析
1.4.3 效应修饰分析
1.4.4 敏感性分析
2 结果
2.1 研究对象信息
表1 研究对象的基本信息、暴露及健康指标的描述性分析Table 1 Descriptive statistics for basic information of participants, exposure and health indicators |
| Variable | Value |
| Gender | |
| Male, n(%) | 85 (88.5) |
| Female, n(%) | 11 (11.5) |
| Age/years, $\bar x \pm s$ | 69.0±6.3 |
| BMI/(kg/m2), $\bar x \pm s$ | 24.0±3.3 |
| Smoking status, n(%) | |
| Never | 19 (19.8) |
| Former | 48 (50.0) |
| Current | 29 (30.2) |
| GOLD stage, n(%) | |
| Ⅰ | 13 (13.5) |
| Ⅱ | 50 (52.1) |
| Ⅲ | 27 (28.1) |
| Ⅳ | 6 (6.3) |
| Lung function, $\bar x \pm s$ | |
| FEV1/L | 1.6±0.6 |
| FEV1%pred/% | 58.4±17.8 |
| FVC/L | 2.8±0.8 |
| FVC%pred/% | 75.5±17.0 |
| FEV1/FVC | 0.57±0.09 |
| Temperature/℃, $\bar x \pm s$ | 27.5±2.6 |
| Humidity/%, $\bar x \pm s$ | 21.1±7.1 |
| Sleep SpO2/%, $\bar x \pm s$ | 94.1±2.6 |
| Air pollutants,$\bar x \pm s$ | |
| PM2.5/(μg/L) | 21.0±18.6 |
| PM10/(μg/L) | 23.0±15.3 |
| NO2/(μg/L) | 15.5±6.6 |
| O3/(μg/L) | 29.5±17.3 |
| SO2/(μg/L) | 0.9±0.4 |
| CO/(mg/L) | 0.5±0.3 |
BMI, body mass index; GOLD, global initiative for chronic obstructive lung disease; FEV1, forced expiratory volume in the first second; pred, predict; FVC, forced vital capacity; SpO2, oxygen saturation; PM2.5, fine particulate matter; PM10, inhalable particulate matter; NO2, nitrogen dioxide; O3, ozone; SO2, sulfur dioxide; CO, carbon dioxide. |
2.2 温度个体暴露与慢阻肺患者睡眠期间SpO2和氧去饱和风险的关联
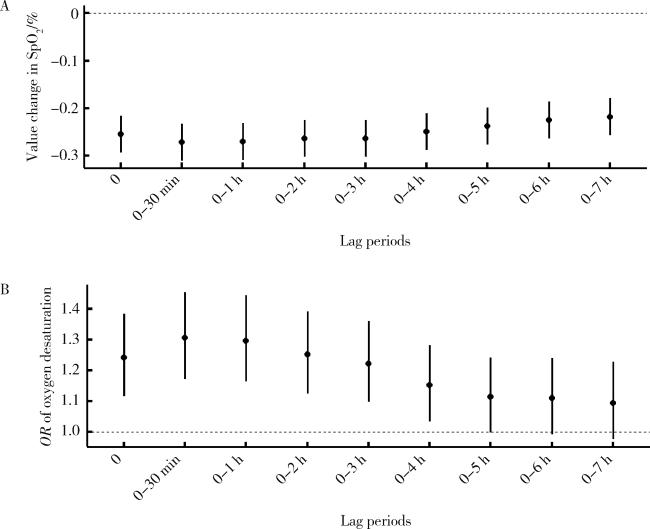
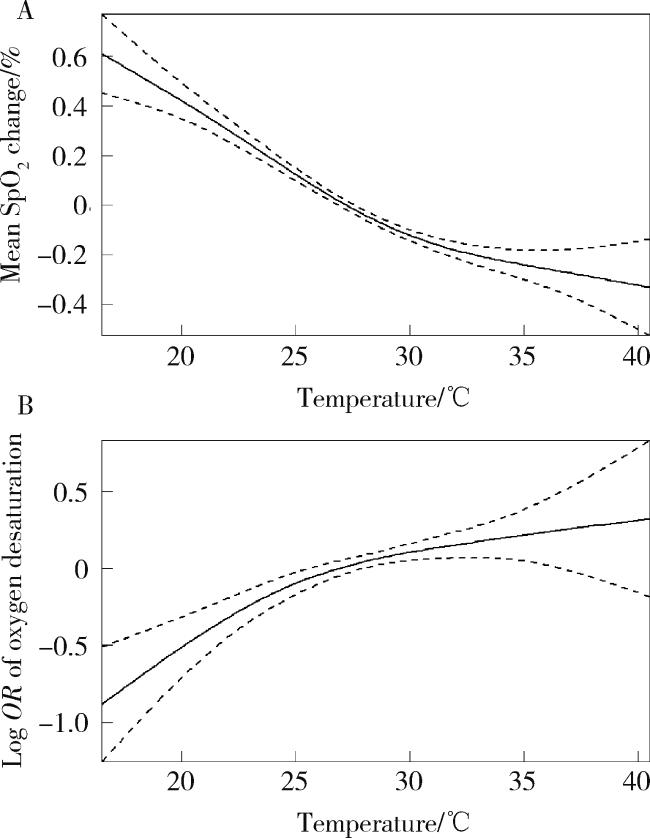
2.3 温度个体暴露与慢阻肺患者睡眠期间SpO2和氧去饱和风险的暴露-反应关系
2.4 温度个体暴露与不同肺功能状态患者睡眠期间SpO2和氧去饱和风险的关联
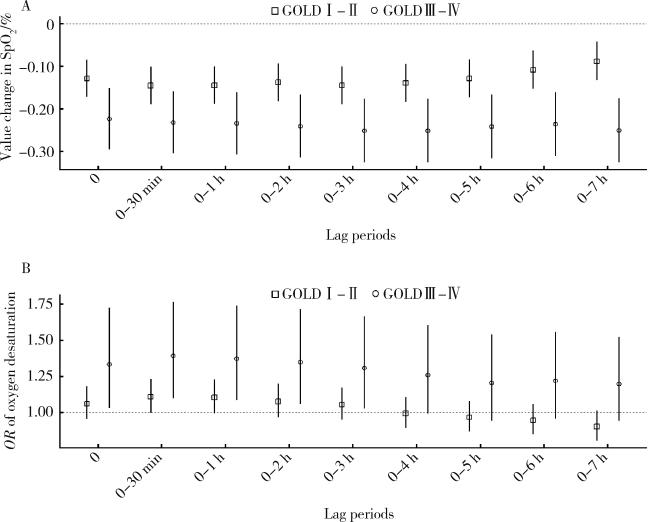
图3 温度个体暴露与不同肺功能状态患者睡眠期间SpO2(A)和氧去饱和风险(B)的关联Figure 3 Association of personal temperature exposure with SpO2(A)and risk of oxygen desaturation(B) during sleep with different pulmonary function statuses SpO2, oxygen saturation; OR, odds ratio; GOLD, global initiative for chronic obstructive lung disease. |
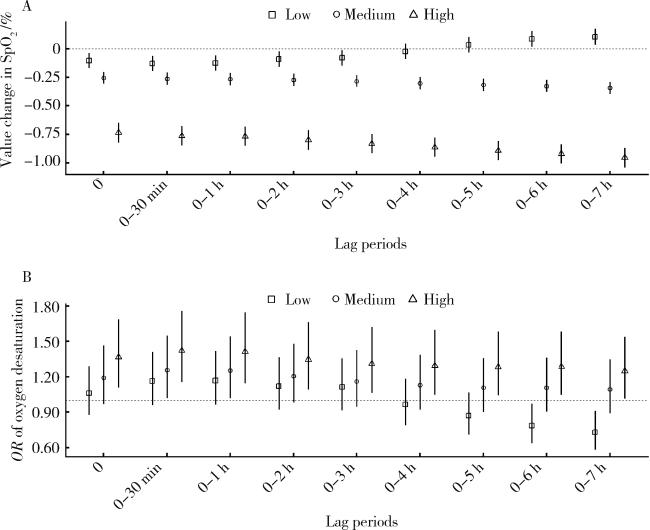
2.5 湿度对温度个体暴露与睡眠期间SpO2关联的效应修饰作用


2.6 敏感性分析
表2 温度个体暴露与睡眠期间SpO2和氧去饱和风险关联的敏感性分析Table 2 Sensitivity analysis of the association between personal temperature exposure and SpO2 and risk of oxygen desaturation during sleep |
| Model | Value change in SpO2(95%CI)/% | P | OR of oxygen desaturation (95%CI) | P |
| Main model | -0.26 (-0.29,-0.22) | < 0.001 | 1.34 (1.20,1.49) | < 0.001 |
| Adjust model | ||||
| +PM10 | -0.21 (-0.24,-0.16) | < 0.001 | 1.23 (1.11,1.37) | < 0.001 |
| +NO2 | -0.23 (-0.27,-0.19) | < 0.001 | 1.30 (1.16,1.45) | < 0.001 |
| +O3 | -0.21 (-0.21,-0.25) | < 0.001 | 1.25 (1.12,1.39) | < 0.001 |
| +SO2 | -0.26 (-0.30,-0.22) | < 0.001 | 1.23 (1.10,1.37) | < 0.001 |
| +CO | -0.18 (-0.22,-0.14) | < 0.001 | 1.18 (1.05,1.32) | < 0.001 |
SpO2, oxygen saturation; CI, confidence interval; OR, odds ratio; PM10, inhalable particulate matter; NO2, nitrogen dioxide; O3, ozone; SO2, sulfur dioxide; CO, carbon dioxide. |