
1 资料与方法
1.1 资料收集
1.2 基因组DNA提取及NGS测序
1.3 KEGG通路富集分析
1.4 克隆进化模式的定义
1.5 系统发育树的构建
1.6 统计学分析
2 结果
2.1 患者的人口统计学和临床基线特征
表1 淋巴结转移性肾细胞癌组和非转移组患者的人口统计学和临床基线特征Table 1 Demographic and clinical characteristics between lymphoid metastatic renal cell carcinoma group and non-metastatic group |
| Variable | Overall | Metastatic group | Non-metastatic group | P value |
| Number of patients | 52 | 31 | 21 | |
| Gender, n (%) | >0.999 | |||
| Female | 19 (36.5) | 11 (35.5) | 8 (38.1) | |
| Male | 33 (63.5) | 20 (64.5) | 13 (61.9) | |
| T stage, n (%) | 0.003 | |||
| Tx | 2 (3.8) | 2 (6.5) | 0 (0) | |
| T0 | 2 (3.8) | 0 (0) | 2 (9.5) | |
| T1 | 14 (26.9) | 3 (9.7) | 11 (52.4) | |
| T2 | 2 (3.8) | 1 (3.2) | 1 (4.8) | |
| T3 | 29 (55.8) | 22 (71.0) | 7 (33.3) | |
| T4 | 3 (5.8) | 3 (9.7) | 0 (0) | |
| Smoking, n (%) | 0.325 | |||
| No | 35 (67.3) | 23 (74.2) | 12 (57.1) | |
| Yes | 17 (32.7) | 8 (25.8) | 9 (42.9) | |
| Drinking, n (%) | 0.415 | |||
| No | 39 (75.0) | 25 (80.6) | 14 (66.7) | |
| Yes | 13 (25.0) | 6 (19.4) | 7 (33.3) | |
| Hypertension, n (%) | 0.367 | |||
| No | 27 (51.9) | 14 (45.2) | 13 (61.9) | |
| Yes | 25 (48.1) | 17 (54.8) | 8 (38.1) | |
| Pathological type, n (%) | 0.293 | |||
| ccRCC | 34 (65.4) | 18 (58.1) | 16 (76.2) | |
| nccRCC | 18 (34.6) | 13 (41.9) | 5 (23.8) | |
| WHO/ISUP grade, n (%) | 0.002 | |||
| 1 | 1 (1.9) | 1 (3.2) | 0 (0) | |
| 2 | 17 (32.7) | 3 (9.7) | 14 (66.7) | |
| 3 | 22 (42.3) | 18 (58.1) | 4 (19.0) | |
| 4 | 12 (23.1) | 9 (29.0) | 3 (14.3) | |
| Tumor thrombus, n (%) | 0.025 | |||
| No | 34 (65.4) | 16 (51.6) | 18 (85.7) | |
| Yes | 18 (34.6) | 15 (48.4) | 3 (14.3) | |
| Age/years, M (P25, P75) | 53.50 (43.00, 63.25) | 53.00 (46.00, 63.50) | 58.00 (43.00, 61.00) | 0.867 |
| Tumor size/cm, M (P25, P75) | 6.70 (4.42, 9.93) | 8.20 (5.85, 10.60) | 4.60 (2.60, 6.50) | 0.006 |
| BMI/(kg/m2), M (P25, P75) | 24.44 (21.96, 26.09) | 24.44 (20.92, 26.02) | 24.42 (23.51, 26.12) | 0.396 |
| Hemoglobin/(g/L), M (P25, P75) | 133.50 (112.00, 150.25) | 128.00 (112.00, 137.00) | 151.00 (132.00, 162.00) | 0.002 |
| BUN/(mmol/L), M (P25, P75) | 5.25 (4.38, 6.00) | 5.55 (4.80, 6.25) | 4.80 (4.00, 5.70) | 0.097 |
| Creatinine/(μmol/L), M (P25, P75) | 80.50 (71.25, 102.25) | 84.00 (71.00, 116.50) | 78.00 (72.00, 85.00) | 0.138 |
ccRCC, clear cell renal cell carcinoma; nccRCC, non-clear cell renal cell carcinomas; WHO/ISUP, World Health Organization/International Society of Urological Pathology; BMI, body mass index; BUN, blood urea nitrogen. |
2.2 总体样本的基因组特征
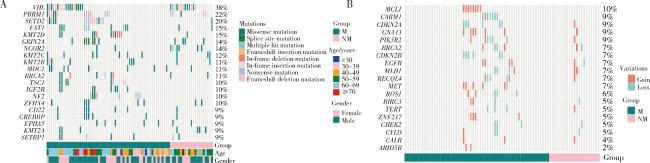
图1 所有肾细胞癌样本的基因突变谱Figure 1 Molecular profile of all renal cell carcinoma samples A, whole exome sequencing revealed the somatic mutations that were most frequent in our cohort. Patients are displayed individually in the columns (grey squares), with colored squares denoting the presence of somatic mutations. B, the copy number variants (CNVs) that are prevalent in this cohort. M, metastatic group; NM, non-metastatic group. |
2.3 淋巴结转移性肾癌与非转移性肾癌的比较
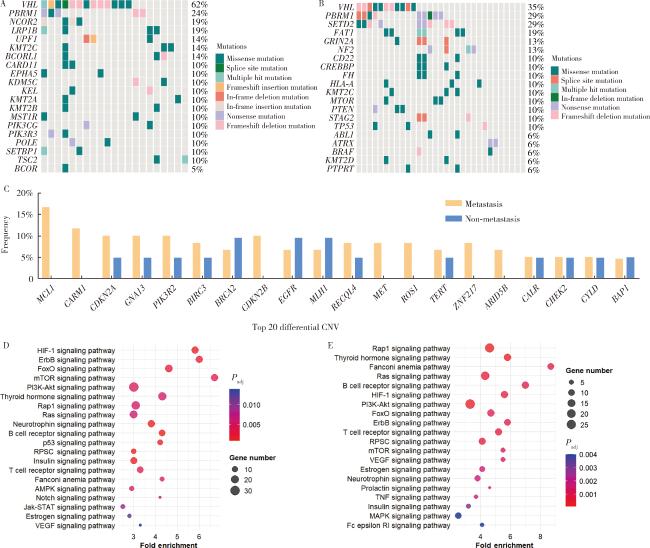
图2 转移性与非转移性肾细胞癌体细胞突变的基因图谱Figure 2 The genomic landscape of somatic mutations in renal cell carcinoma with or without lymphoid metastasis A, oncoprint illustrations of somatic alterations in nonmetastatic RCC by gene frequency; B, oncoprint illustrations of somatic alterations in metastatic RCC by gene frequency; C, the top 20 differential CNV between metastatic and nonmetastatic ccRCC patients; D, KEGG analysis of mutated genes with different prevalence in the nonmetastatic group; E, KEGG analysis of mutated genes with different prevalence in the metastatic group. RPSC signaling pathway: signaling pathways regulating pluripotency of stem cells. RCC, renal cell carcinoma; ccRCC, clear cell renal cell carcinoma; CNV, copy number variants; Padj, adjusted P value; KEGG, Kyoto Encyclopedia of Genes and Genomes. |
2.4 肾癌原发灶和淋巴结转移灶之间的基因突变差异
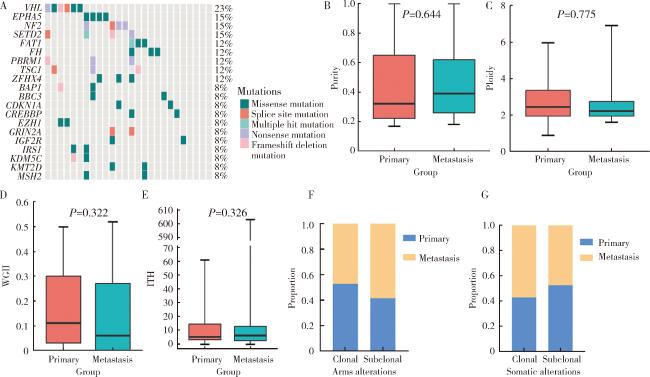
图3 转移性肾细胞癌原发灶和转移灶的差异突变模式Figure 3 Discordance of mutation patterns between primary and metastatic renal cell carcinoma A, oncoprint illustrations of somatic alterations in metastasis by gene frequency. B-E, four box plots summarizing: purity, ploidy, weighted-genomic integrity index (WGII), and intra-tumor heterogeneity (ITH). Values are compared between primary and metastatic tumors, and the P value is at the top of the plot. F, composition of clonal and subclonal arms alterations in the primary and metastatic tumors. G, composition of clonal and subclonal somatic alterations in the primary and metastatic tumors. |
2.5 转移驱动因素分析
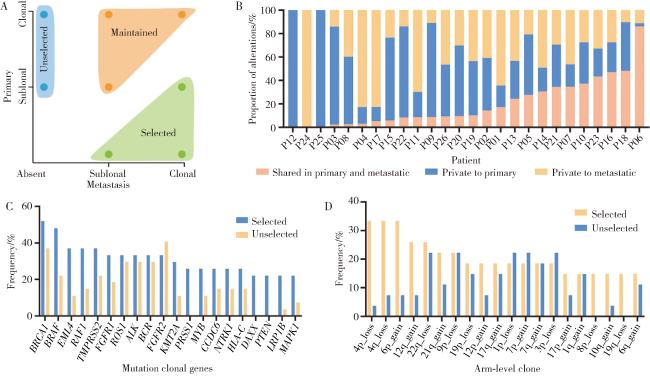
图4 肾细胞癌原发灶和转移灶之间的克隆进化特征Figure 4 Characterization of metastasizing clones between primary and metastatic renal cell carcinoma A, illustration of the method used to categorize tumor clones. B, shared and private mutations among the paired primary and metastatic samples. Every column represents a patient and the height of the column depicts the percentage of mutations in that pair. C, the selection of alterations between primary tumor and metastasis, the bar chart demonstrates the percentage of mutation clonal genes. D, the selection of alterations between primary tumor and metastasis, the bar chart demonstrates the percentage of arm-level clone. |
2.6 肾癌的淋巴结转移分析
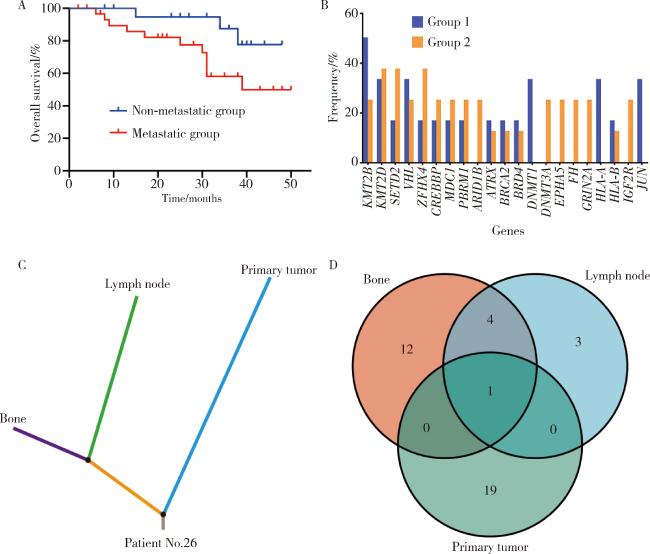


图5 肾细胞癌淋巴结转移与预后的关联分析Figure 5 Correlation analysis between lymph node metastasis and prognosis in renal cell carcinoma A, Kaplan-Meier curve showing the overall survival (OS) to time of death compared by lymphatic metastasis via the Log-rank test. Patients lost to follow-up were censored from analysis and are represented by the tick marks on the curves. B, the frequency of genes with different prevalence between different prognostic groups. Group 1 represented the population in which an outcome event (death) occurred during follow-up. Group 2 represented the patients who were still alive at the last follow-up. C-D, lymph nodes act as a "metastatic pool" to support distant metastasis of the tumor. C, molecular evolution in a typical renal cell carcinoma patient with both lymph node and bone metastases, and the number of mutations determines the length of the corresponding branch and trunk. D, venn diagram illustrated the overlap and independently mutated genes between the primary tumor, lymph node and bone metastases. |