
1 资料与方法
1.1 儿童肾移植患者一般资料
1.2 免疫抑制方案
1.3 分组与观察指标
1.4 统计学分析
2 结果
2.1 儿童肾移植受者的一般信息及贫血发生情况
表1 儿童肾移植受者的基线临床资料及人口学特征Table 1 Baseline clinical and demographic characteristics of pediatric kidney transplant recipients |
| Items | Values |
| Demographic characteristics | |
| Age/years | 11.8±3.2 |
| Gender (male) | 28 (60.9) |
| Height/cm | 147.3±19.9 |
| Weight/kg | 36.6±13.5 |
| BMI/(kg/m2) | 16.4±3.2 |
| Etiology of end-stage renal disease | |
| Glomerular disease | 10 (21.7) |
| Hereditary kidney disease | 7 (15.2) |
| CAKUT | 6 (13.0) |
| Tubulointerstitial disease | 2 (4.3) |
| Neoplastic kidney disease | 1 (2.2) |
| Unknown | 20 (43.5) |
| Preoperative renal replacement therapy | |
| HD | 16 (34.8) |
| PD | 20 (43.5) |
| Both HD and PD | 6 (13.0) |
| No dialysis | 4 (8.7) |
| Clinical indicators | |
| Hb/(g/L) | 107.2±23.8 |
| Scr/(μmol/L) | 756.7±266.4 |
| eGFR/[mL/(min·1.73 m2)] | 8.7±5.7 |
Data are presented as $\bar x \pm s$ or n (%). BMI, body mass index; CAKUT, congenital anomalies of the kidney and urinary tract; HD, hemodialysis; PD, peritoneal dialysis; Hb, hemoglobin; Scr, serum creatinine; eGFR, estimated glomerular filtration rate. |
表2 儿童肾移植术后临床观察指标的变化Table 2 Changes of clinical data in pediatric patients after kidney transplantation |
| Time points | RBC/(×1012/L) | Hb/(g/L) | HCT/% | MCV/fL | MCH/pg | MCHC/(g/L) | RDW-CV/% |
| Preoperatively | 3.6±0.9 | 107.2±23.8 | 32.3±7.5 | 89.0±6.8 | 29.6±2.4 | 332.5±15.5 | 13.4±1.4 |
| 1 month postoperatively | 3.8±0.6 | 114.2±15.6 | 35.5±4.6 | 93.4±6.1 | 30.0±2.2 | 321.3±11.1 | 15.3±2.0 |
| 2 months postoperatively | 4.2±0.5 | 124.0±14.0 | 37.8±4.3 | 89.4±6.1 | 23.3±2.2 | 328.2±11.3 | 13.2±1.0 |
| 3 months postoperatively | 4.3±0.7 | 123.1±17.7 | 37.8±5.4 | 87.4±6.3 | 28.5±2.3 | 326.3±11.8 | 12.8±1.3 |
| 4 months postoperatively | 4.4±0.6 | 123.5±16.1 | 38.0±4.7 | 85.8±6.0 | 27.9±2.4 | 325.4±11.8 | 12.7±1.2 |
| 5 months postoperatively | 4.4±0.7 | 121.2±15.4 | 37.3±4.7 | 84.4±5.7 | 27.5±2.4 | 325.0±13.2 | 13.0±1.1 |
| 6 months postoperatively | 4.5±0.6 | 122.4±14.1 | 37.8±4.4 | 83.6±5.7 | 27.1±2.2 | 324.3±12.7 | 13.2±1.3 |
| Time points | RDW-SD/fL | Serum urea/(mmol/L) | Scr/(μmol/L) | eGFR/[mL/(min·1.73 m2)] | UA/(μmol/L) | Tacrolimus blood concentration/(μg/L) | |
| Preoperatively | 42.9±6.1 | 21.3±6.4 | 756.7±266.4 | 8.7±5.7 | 435.7±112.2 | ||
| 1 month postoperatively | 51.5±7.4 | 7.8±2.8 | 67.5±23.8 | 130.8±29.8 | 302.2±108.2 | 11.1±4.3 | |
| 2 months postoperatively | 43.1±4.0 | 6.6±2.3 | 72.7±31.1 | 127.0±32.4 | 342.9±113.4 | 10.4±2.7 | |
| 3 months postoperatively | 40.5±3.8 | 7.1±5.2 | 77.2±59.4 | 129.0±35.4 | 340.2±106.6 | 9.3±2.0 | |
| 4 months postoperatively | 39.4±3.8 | 6.6±2.2 | 71.4±42.8 | 130.7±29.8 | 364.0±92.6 | 9.4±2.0 | |
| 5 months postoperatively | 37.8±3.6 | 6.9±3.1 | 70.7±46.4 | 132.7±32.4 | 368.1±81.8 | 9.4±3.1 | |
| 6 months postoperatively | 39.9±3.8 | 6.7±2.8 | 73.2±62.9 | 133.7±33.7 | 367.8±94.8 | 9.2±2.8 | |
RBC, red blood cell count; Hb, hemoglobin; HCT, hematocrit; MCV, mean corpuscular volume; MCH, mean corpuscular hemoglobin; MCHC, mean corpuscular hemoglobin concentration; RDW-CV, coefficient of variation of red blood cell distribution width; RDW-SD, standard deviation of red blood cell distribution width; Scr, serum creatinine; eGFR, estimated glomerular filtration rate; UA, uric acid. |
2.2 儿童肾移植术后6个月贫血的独立相关因素
表3 PTA相关因素的单因素分析Table 3 Univariate analysis of associated factors for PTA |
| Variables | PTA group | Non-PTA group | P value |
| Number of cases | 19 | 27 | |
| Age/years, $\bar x \pm s$ (range) | 11.2±3.4 (3-17) | 12.3±3.0 (6-17) | 0.222 |
| BMI/(kg/m2), $\bar x \pm s$ | 16.4±3.7 | 16.4±2.8 | 0.973 |
| Gender, n (%) | 0.337 | ||
| Male | 10 (35.7) | 18 (64.3) | |
| Female | 9 (50.0) | 9 (50.0) | |
| Preoperative renal replacement therapy | 0.368 | ||
| No dialysis | 3 | 1 | |
| HD | 7 | 9 | |
| PD | 6 | 14 | |
| Both HD and PD | 3 | 3 | |
| Graft dysfunction | 1 | 0 | 0.228 |
| Viral infection | 6 | 8 | 0.888 |
| BKV | 4 | 8 | |
| B19 | 1 | 0 | |
| EBV | 1 | 0 | |
| Postoperative complications, n (%) | |||
| Myelosuppression | 5 (26.3) | 9 (33.3) | 0.611 |
| Gout | 10 (52.6) | 15 (55.6) | 0.845 |
| Renal osteodystrophy | 9 (47.4) | 12 (44.4) | 0.845 |
| Hypothyroidism | 4 (21.1) | 5 (18.5) | 0.831 |
| Hyperparathyroidism | 3 (15.8) | 6 (22.2) | 0.588 |
| Perirenal hematoma | 1 (5.3) | 0 (0) | 0.228 |
| Renal cyst | 0 (0) | 3 (11.1) | 0.133 |
| Preoperative indicators, $\bar x \pm s$ | |||
| MCHC/(g/L) | 328.2±12.9 | 335.5±16.6 | 0.058 |
| MCH/pg | 29.1±2.2 | 29.9±2.5 | 0.195 |
| MCV/fL | 88.7±5.9 | 89.3±7.4 | 0.885 |
| RBC/(×1012/L) | 3.6±2.4 | 3.7±0.9 | 0.859 |
| Hb/(g/L) | 105.4±28.2 | 108.4±20.6 | 0.600 |
| HCT/% | 32.1±8.4 | 32.4±6.9 | 0.780 |
| Serum urea/(mmol/L) | 20.5±5.7 | 21.8±6.9 | 0.600 |
| Scr/(μmol/L) | 721.5±294.2 | 781.6±247.8 | 0.289 |
| eGFR/[mL/(min·1.73 m2)] | 9.4±5.4 | 8.2±5.9 | 0.489 |
| UA/(μmol/L) | 415.3±115.2 | 450.1±109.9 | 0.300 |
| Indicators at 6 months postoperatively, $\bar x \pm s$ | |||
| Serum urea/(mmol/L) | 8.4±3.5 | 5.5±1.3 | 0.001 |
| eGFR/[mL/(min·1.73 m2)] | 120.6±42.9 | 142.9±21.9 | 0.025 |
| Scr/(μmol/L) | 94.1±93.0 | 58.6±17.7 | 0.058 |
| UA/(μmol/L) | 371.4±72.5 | 365.3±109.1 | 0.832 |
| MCV/fL | 82.9±5.4 | 84.2±6.0 | 0.624 |
| MCH/pg | 26.9±2.2 | 27.3±2.3 | 0.584 |
| MCHC/(g/L) | 324.6±11.9 | 324.2±13.4 | 0.893 |
| Tacrolimus blood concentration/(μg/L) | 9.2±2.4 | 9.3±3.1 | 0.933 |
PTA, post-transplantation anemia; BMI, body mass index; HD, hemodialysis; PD, peritoneal dialysis; BKV, BK virus; EBV, Epstein-Barr virus; B19, parvovirus B19; Other abbreviations as in Table 2. |
表4 PTA相关因素的Logistic多因素回归分析Table 4 Multivariate Logistic regression analysis of associated factors for PTA |
| Variables | B | SE | Wald | P | Exp (B) (95%CI) |
| Age | -0.670 | 0.284 | 5.554 | 0.018 | 0.512 (0.293, 0.893) |
| Postoperative urea | 1.188 | 0.435 | 7.465 | 0.006 | 3.281 (1.399, 7.695) |
| Postoperative eGFR | -0.113 | 0.052 | 4.715 | 0.030 | 0.893 (0.807, 0.989) |
| Postoperative Scr | -0.047 | 0.027 | 3.163 | 0.075 | 0.954 (0.906, 1.005) |
| Constant | 118.005 | 110.220 | 3.104 | 0.078 |
PTA, post-transplantation anemia; eGFR, estimated glomerular filtration rate; Scr, serum creatinine. |
2.3 分层分析
表5 PTA相关因素的分层分析Table 5 Stratified analysis of associated factors for PTA |
| PTA group | Non-PTA group | P value | |
| Age ≤5 years | 1/18 | 0/27 | 0.228 |
| Age ≤9 years | 5/14 | 5/22 | 0.307 |
| Age ≤13 years | 16/3 | 14/13 | 0.032 |
| Serum urea >7 mmol/L | 9/10 | 1/26 | < 0.001 |
| eGFR < 120 mL/(min·1.73 m2) | 7/12 | 2/25 | 0.037 |
PTA, post-transplantation anemia; eGFR, estimated glomerular filtration rate. |
2.4 年龄、血清尿素、eGFR与贫血的相关性分析
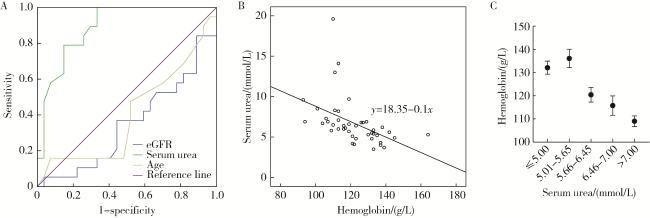


图1 移植肾功能与Hb水平的相关性分析Figure 1 Correlation analysis between transplanted kidney function and Hb level A, ROC curve; B, Pearson correlation analysis; C, Hb levels corresponding to different serum urea levels. ROC, receiver operating characteristic; eGFR, estimated glomerular filtration rate; Hb, hemoglobin. |