
1 资料与方法
1.1 一般资料
1.2 手术及随访
1.3 统计学分析
2 结果
2.1 病例基本信息
表1 UTUC患者的临床资料Table 1 Clinical characteristics of patients with UTUC |
| Indicator | Total (n=481) |
| Age/years | 66.55±9.78 |
| Gender | |
| Male | 248 (51.6) |
| Female | 233 (48.4) |
| Smoking | 73 (15.2) |
| Previous bladder cancer | 30 (6.2) |
| Concomitant bladder cancer | 41 (8.5) |
| T | |
| Ta/T1 | 119 (24.7) |
| T2 | 121 (25.2) |
| T3/T4 | 241 (50.1) |
| N | |
| Nx/N0 | 464 (96.5) |
| N1/N2 | 17 (3.5) |
| Location | |
| Ureter | 192 (39.9) |
| Renal pelvis | 227 (47.2) |
| Ureter + Renal pelvis | 62 (12.9) |
| Multifocality | 112 (23.3) |
| WHO/ISUP grade | |
| Low grade | 86 (17.9) |
| High grade | 395 (82.1) |
| eGFR/[mL/(min·1.73 m2)] | 64.44±25.42 |
| Surgical approach | |
| Open | 39 (8.1) |
| Laparoscopic | 442 (91.9) |
| Surgical access | |
| Transabdominal | 80 (16.6) |
| Retroperitoneal | 401 (83.4) |
| Distal ureter management | |
| Total laparoscopic | 129 (26.8) |
| Bladder opening | 321 (66.7) |
| Endoscopic-assisted | 31 (6.4) |
| Lymph node dissection | 88 (18.3) |
| Intravesical instillation | 31 (6.4) |
| Blood transfusion | 96 (20.0) |
Data are n(%) or ${\bar x}$±s UTUC, upper tract urothelial carcinoma; WHO/ISUP, World Health Organization/International Society of Urological Pathology; eGFR, estimated glomerular filtration rate. |
2.2 Cox回归分析
表2 影响UTUC术后OS的单因素和多因素Cox回归分析Table 2 Univariate and multivariate Cox analysis of factors influencing OS after UTUC surgery |
| Variable | Univariate analysis | Multivariate analysis | |||||
| HR | 95%CI | P | HR | 95%CI | P | ||
| Age/years | 1.027 | 1.010-1.044 | 0.002 | 1.008 | 0.990-1.026 | 0.401 | |
| Gendera | |||||||
| Male | Reference | ||||||
| Female | 0.863 | 0.636-1.172 | 0.346 | ||||
| Smoking index (cigarettes·years) | 1.000 | 0.999-1.000 | 0.334 | ||||
| Previous bladder cancera | 1.779 | 1.045-3.026 | 0.034 | 1.396 | 0.806-2.420 | 0.234 | |
| Concomitant bladder cancera | 1.552 | 0.951-2.533 | 0.079 | 1.180 | 0.712-1.958 | 0.520 | |
| Ta | |||||||
| Ta/T1 | Reference | ||||||
| T2 | 2.250 | 1.235-4.102 | 0.008 | 1.681 | 0.908-3.112 | 0.098 | |
| T3/T4 | 4.906 | 2.907-8.278 | < 0.001 | 3.716 | 2.166-6.374 | < 0.001 | |
| Na | |||||||
| Nx/N0 | Reference | ||||||
| N1/N2 | 3.298 | 1.783-6.098 | < 0.001 | 2.003 | 1.071-3.748 | 0.030 | |
| Locationa | |||||||
| Renal pelvis | Reference | ||||||
| Ureter | 1.022 | 0.734-1.422 | 0.899 | ||||
| Ureter + renal pelvis | 0.999 | 0.615-1.622 | 0.997 | ||||
| Multiple vs. singlea | 0.967 | 0.669-1.396 | 0.857 | ||||
| WHO/ISUP gradea | |||||||
| Low grade | Reference | ||||||
| High grade | 2.399 | 1.467-3.923 | < 0.001 | 1.827 | 1.095-3.046 | 0.021 | |
| eGFR/[mL/(min·1.73 m2)] | 0.985 | 0.978-0.991 | < 0.001 | 0.993 | 0.986-1.000 | 0.038 | |
| Surgical approacha | |||||||
| Open | Reference | ||||||
| Laparoscopic | 0.571 | 0.363-0.898 | 0.015 | 0.687 | 0.431-1.096 | 0.115 | |
| Surgical accessa | |||||||
| Transabdominal | Reference | ||||||
| Retroperitoneal | 0.932 | 0.608-1.429 | 0.748 | ||||
| Distal ureter managementa | |||||||
| Total laparoscopic | Reference | ||||||
| Bladder opening | 0.479 | 0.348-0.660 | < 0.001 | 0.574 | 0.412-0.798 | < 0.001 | |
| Endoscopic-assisted | 0.431 | 0.214-0.867 | 0.018 | 0.465 | 0.228-0.950 | 0.036 | |
| Lymph node dissectiona | 0.983 | 0.640-1.509 | 0.937 | ||||
| Intravesical instillationa | 0.992 | 0.538-1.831 | 0.980 | ||||
| Blood transfusiona | 2.117 | 1.521-2.948 | < 0.001 | 1.807 | 1.275-2.562 | < 0.001 | |
| GNRI | 0.969 | 0.953-0.985 | < 0.001 | 0.979 | 0.963-0.996 | 0.017 | |
| PNI | 0.946 | 0.921-0.972 | < 0.001 | 0.969 | 0.941-0.997 | 0.032 | |
| CONUT | 1.145 | 1.028-1.274 | 0.014 | 1.045 | 0.932-1.171 | 0.453 | |
| TCBI | 1.000 | 0.999-1.001 | 0.899 | ||||
CI, confidence interval; HR, hazard ratio; UTUC, upper tract urothelial carcinoma; OS, overall survival; WHO/ISUP, World Health Organization/International Society of Urological Pathology; eGFR, estimated glomerular filtration rate; GNRI, geriatric nutritional risk index; PNI, prognostic nutritional index; CONUT, controlling nutritional status; TCBI, triglyceride-total cholestorol-body mass index. a, included in the regression model as a categorical variable; reference category as listed. |
表3 影响UTUC术后CSS的单因素和多因素Cox回归分析Table 3 Univariate and multivariate Cox analysis of factors influencing CSS after UTUC surgery |
| Variable | Univariate analysis | Multivariate analysis | |||||
| HR | 95%CI | P | HR | 95%CI | P | ||
| Age/years | 1.009 | 0.989-1.030 | 0.376 | ||||
| Gendera | |||||||
| Male | Reference | ||||||
| Female | 0.806 | 0.541-1.200 | 0.288 | ||||
| Smoking index (cigarettes×years) | 0.999 | 0.998-1.000 | 0.081 | 0.999 | 0.998-1.000 | 0.104 | |
| Previous bladder cancera | 1.132 | 0.495-2.585 | 0.769 | ||||
| Concomitant bladder cancera | 1.730 | 0.945-3.166 | 0.075 | 1.294 | 0.690-2.426 | 0.422 | |
| Ta | |||||||
| Ta/T1 | Reference | ||||||
| T2 | 6.232 | 1.826-21.266 | 0.003 | 4.159 | 1.194-14.484 | 0.025 | |
| T3/T4 | 16.667 | 5.259-52.828 | < 0.001 | 11.988 | 3.708-38.759 | < 0.001 | |
| Na | |||||||
| Nx/N0 | Reference | ||||||
| N1/N2 | 4.867 | 2.523-9.386 | < 0.001 | 2.986 | 1.530-5.826 | 0.001 | |
| Locationa | |||||||
| Renal pelvis | Reference | ||||||
| Ureter | 1.184 | 0.770-1.822 | 0.441 | ||||
| Ureter+renal pelvis | 1.142 | 0.613-2.128 | 0.676 | ||||
| Multiple vs. singlea | 1.137 | 0.722-1.791 | 0.580 | ||||
| WHO/ISUP gradea | |||||||
| Low grade | Reference | ||||||
| High grade | 3.554 | 1.644-7.682 | 0.001 | 1.838 | 0.831-4.063 | 0.133 | |
| eGFR/[mL/(min·1.73 m2)] | 0.988 | 0.980-0.996 | 0.005 | 0.999 | 0.989-1.009 | 0.837 | |
| Surgical approacha | |||||||
| Open | Reference | ||||||
| Laparoscopic | 0.475 | 0.269-0.839 | 0.010 | 0.515 | 0.287-0.925 | 0.026 | |
| Surgical accessa | |||||||
| Transabdominal | Reference | ||||||
| Retroperitoneal | 0.637 | 0.392-1.034 | 0.068 | 0.901 | 0.529-1.534 | 0.700 | |
| Distal ureter managementa | |||||||
| Total laparoscopic | Reference | ||||||
| Bladder opening | 0.509 | 0.334-0.777 | 0.002 | 0.646 | 0.416-1.005 | 0.053 | |
| Endoscopic-assisted | 0.672 | 0.299-1.510 | 0.335 | 0.789 | 0.341-1.824 | 0.579 | |
| Lymph node dissectiona | 1.323 | 0.807-2.168 | 0.267 | ||||
| Intravesical instillationa | 0.913 | 0.400-2.087 | 0.829 | ||||
| Blood transfusiona | 2.024 | 1.309-3.131 | 0.002 | 1.835 | 1.169-2.880 | 0.008 | |
| GNRI | 0.966 | 0.946-0.987 | 0.002 | 0.971 | 0.950-0.991 | 0.005 | |
| PNI | 0.946 | 0.913-0.980 | 0.002 | 0.959 | 0.924-0.995 | 0.025 | |
| CONUT | 1.165 | 1.017-1.335 | 0.027 | 1.122 | 0.974-1.292 | 0.110 | |
| TCBI | 1.000 | 0.998-1.001 | 0.511 | ||||
CI, confidence interval; HR, hazard ratio; UTUC, upper tract urothelial carcinoma; CSS, cancer-specific survival; WHO/ISUP, World Health Organization/International Society of Urological Pathology; eGFR, estimated glomerular filtration rate; GNRI, geriatric nutritional risk index; PNI, prognostic nutritional index; CONUT, controlling nutritional status; TCBI, triglyceride-total cholesterol-body mass index. a, included in the regression model as a categorical variable; reference category as listed. |
2.3 GNRI和PNI的ROC曲线
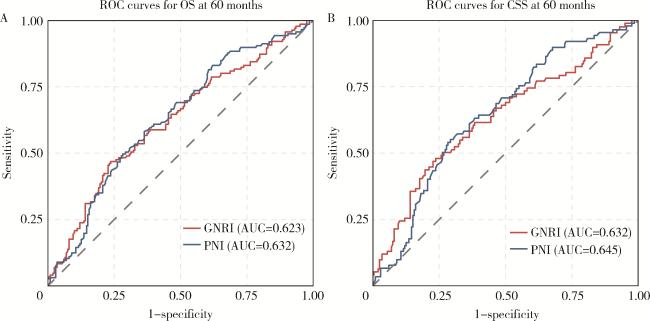
图1 GNRI和PNI预测60月OS(A)和CSS(B)生存情况的ROCFigure 1 ROC curves of GNRI and PNI in predicting OS (A) and CSS (B) survival at 60 months GNRI, geriatric nutritional risk index; PNI, prognostic nutritional index; OS, overall survival; CSS, cancer-specific survival; ROC, receiver operating characteristic; AUC, area under the curve. |
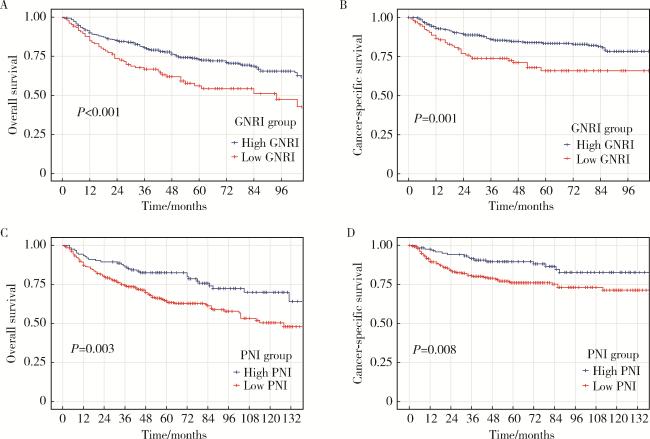
2.4 GNRI和PNI的Kaplan-Meier生存曲线
2.5 GNRI和PNI的时间依赖性ROC线下面积
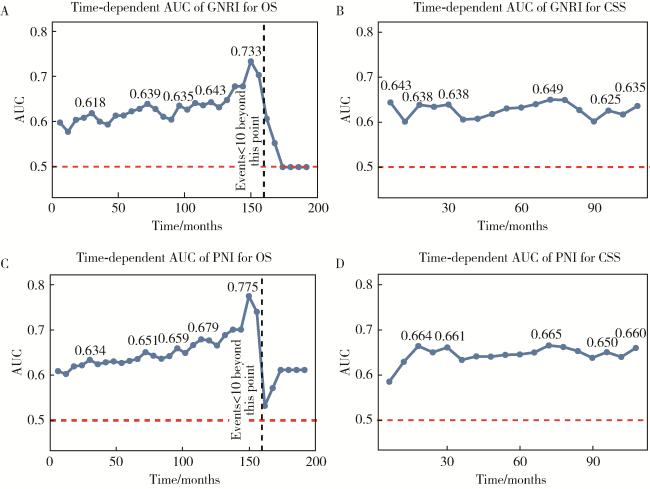
图3 GNRI(A和B)和PNI(C和D)预测生存AUC随时间变化曲线,AUC阶段峰值标注Figure 3 Time-dependent AUC curves for GNRI (A, C) and PNI (B, D) predicting survival, with stage peak AUC values marked GNRI, geriatric nutritional risk index; PNI, prognostic nutritional index; OS, overall survival; CSS, cancer-specific survival; AUC, area under the curve. |
2.6 GNRI和PNI的多因素列线图
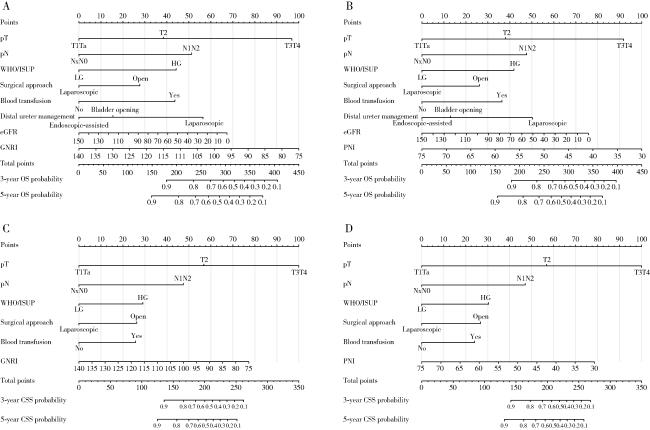


图4 GNRI预测OS(A)、PNI预测OS(B)、GNRI预测CSS(C)和PNI预测CSS(D)的列线图Figure 4 Nomograms for GNRI predicting OS (A), PNI predicting OS (B), GNRI predicting CSS (C) and PNI predicting CSS (D) GNRI, geriatric nutritional risk index; PNI, prognostic nutritional index; OS, overall survival; CSS, cancer-specific survival; pT, pathological tumor stage; pN, pathological node stage; WHO/ISUP, World Health Organization/International Society of Urological Pathology; eGFR, estimated glomerular filtration rate; LG, low grade; HG, high grade. |