
胃炎和十二指肠炎(gastritis and duodenitis,GD)是消化科门诊最常见的疾病类型之一,其全球年龄标准化(以下简称标化)发病率约为323.24/10万,也是导致成人反复出现慢性腹痛、反酸、餐后饱胀、消化不良等症状的首要病因[1]。临床实践中,患者对慢性GD的认识不足,亟需开展分层化健康宣教与自我管理指导[2]。从临床预后来看,慢性活动性GD若未得到规范治疗,可能逐步进展为萎缩性胃炎、肠上皮化生,甚至增加早期胃癌的发生风险[3-4]。已有临床研究证实,慢性萎缩性胃炎患者的胃癌发病风险较健康人群增加4.12倍,而中国作为胃癌高发国家,GD的长期管理不善将直接加剧这一负担[5]。此外,GD患者因症状反复需频繁就诊、长期用药,不仅导致个人医疗支出增加,还可能因腹痛、乏力等症状影响工作效率,对社会生产力造成隐性损耗[6]。随着我国居民饮食结构西化、工作节奏加快、精神压力增加等生活方式因素变化,叠加人口老龄化进程加速,GD的疾病谱特征与负担分布可能已发生显著演变[7]。
然而,当前针对中国GD的流行病学研究多局限于某一省份或短期数据,缺乏覆盖全国、跨度大的长期负担分析,既无法呈现长期以来GD发病、死亡的动态变化,也难以明确不同年龄、不同生活习惯人群的风险差异,导致临床防控策略缺乏全面的数据支撑[8-9]。全球疾病负担研究(Global Burden of Disease Study,GBD)作为国际权威的疾病负担评估体系,涵盖了中国GD长期、全面的负担数据,为填补上述研究空白提供了可靠的数据基础。因此,本研究依托GBD 2023的数据,聚焦中国全人群GD疾病负担,旨在通过多维度分析厘清1990—2023年发病、患病、死亡、伤残调整寿命年(disability-adjusted life year,DALY)数及各指标年龄标准化率的长期演变规律,识别年龄-时期-队列效应与人口、流行病学等驱动因素,预测2024—2040年负担态势。本研究将系统呈现中国GD近30余年的负担变化全貌,为制定针对性的GD防控策略提供科学数据支撑,进而助力降低GD疾病负担、提升居民消化系统健康水平。
1 资料与方法
1.1 数据来源
本研究数据源自GBD 2023[10],该项目构建了标准化疾病负担评估体系,整合全球204个国家/地区389种疾病与伤害的流行病学数据,量化多类风险因素对疾病负担的影响权重,其多维度评估框架为全球公共卫生决策提供了重要支撑。因GBD 2023为公开可获取资源,且本研究为国家层面分析,故无需额外申请分析许可,数据使用均遵循其共享协议。GBD 2023数据库中中国人群GD相关原始数据主要整合自全国疾病监测点系统、住院与门诊病案记录、城乡居民医疗保险与新型农村合作医疗结算数据、全国慢性病及危险因素监测调查、消化内镜检查登记数据及相关流行病学抽样调查,经统一标准化建模与校正后形成可比较的疾病负担估算结果,保障了数据的代表性与可靠性。
1.2 指标选取
本研究从GBD 2023数据库提取1990—2023年中国≥20岁人群的GD发病、患病、死亡及DALY数据,具体操作流程如下:在“GBD Results Tool”界面,于“GBD Estimate”模块选择“Cause of death or injury”;“Measure”维度依次选取“Incidence”“Death”“Prevalence”与“DALY”;“Metric”选择“Number”和“Rate”;“Cause”模块指定“Gastritis and duodenitis”;“Location”选定“China”;“Age”维度选取“20-24 years”至“95+ years”的所有5岁分组数据;“Sex”分别选择“Female”“Male”及“Both”;“Year”覆盖1990—2023年全部年份。其中,发病数直接反映GD发病规模,发病率表征发病风险;患病数体现GD患病广度,患病率呈现患病风险;死亡数衡量致死规模,死亡率表征致死风险。DALY综合反映健康损失,DALY率排除人口规模干扰,便于客观评估负担。标化率用于消除人口年龄结构混杂,便于开展跨年度趋势比较,该指标由本研究采用标准人口统一计算得出。
本研究采用GBD 2023对GD的定义,即由多种病因引起的胃黏膜及十二指肠黏膜炎症性病变,包括急性与慢性炎症、非萎缩性胃炎、十二指肠炎等,不包含消化性溃疡、萎缩性胃炎、肠化生及肿瘤性病变。GBD 2023对GD的诊断依据整合自全球标准化流行病学调查、住院/门诊病案、医疗保险结算数据、消化内镜检查报告及尸检数据,采用《疾病和有关健康问题的国际统计分类(第十次修订本)》(International Statistical Classification of Diseases and Related Health Problems,10th Revision,ICD-10)编码进行疾病归类,主要包括:K29.1(胃炎)、K29.2(十二指肠炎)、K29.3~K29.6(其他及未特指的胃和十二指肠炎症)。诊断标准遵循GBD全球统一的疾病分类与归因规则,以保证不同地区、不同年份数据的可比性。
1.3 统计学分析
本研究借助Excel 2023完成数据预处理工作,依托Stata 16.0与R 4.4.1 软件平台,开展统计建模与结果可视化分析。标化率采用2000年全国第五次人口普查数据作为标准人口计算,以消除人口结构差异对结果的影响。采用Joinpoint回归对1990—2023年GD标化率实施分段对数线性拟合,识别趋势转折点后,估算各时段年度变化百分比(annual percent change,APC)及总体平均年度百分比变化(average annual percent change,AAPC),以此量化不同时期GD疾病负担的变动规律。采用内源性约束的年龄-时期-队列模型,通过施加总和为零的约束避免模型固有完全共线性问题,即对年龄效应、时期效应、出生队列效应三组系数分别施加组内系数之和为0的约束条件,实现模型参数可识别与稳定估计;以相对危险度(relative risk,RR)为核心指标,评估不同年龄、时期及出生队列对发病、患病及死亡风险的作用,RR值越高表明风险水平越高。基于Das Gupta分解法,将GD发病数变化拆解为人口结构变化、人口增长及流行病学特征演变三类驱动要素,量化各因素对总体变化的贡献占比(总和为100%)。此外,借助 R 4.4.1 软件forecast包构建自回归积分滑动平均(autoregressive integrated moving average,ARIMA)模型,先通过时序图与单位根检验判断序列平稳性,对非平稳序列进行差分处理;再依据自相关函数与偏自相关函数图形特征进行模型识别与定阶(p,d,q),并以赤池信息准则(Akaike information criterion,AIC)和贝叶斯信息准则(Bayesian information criterion,BIC)最小化原则优选最优模型;采用Ljung-Box检验验证残差为白噪声,确保模型拟合充分后,用于2024—2040年中国GD疾病负担的趋势外推预测。本研究检验水准设定为α=0.05(双侧)。
2 结果
2.1 1990—2023年中国GD疾病负担变化
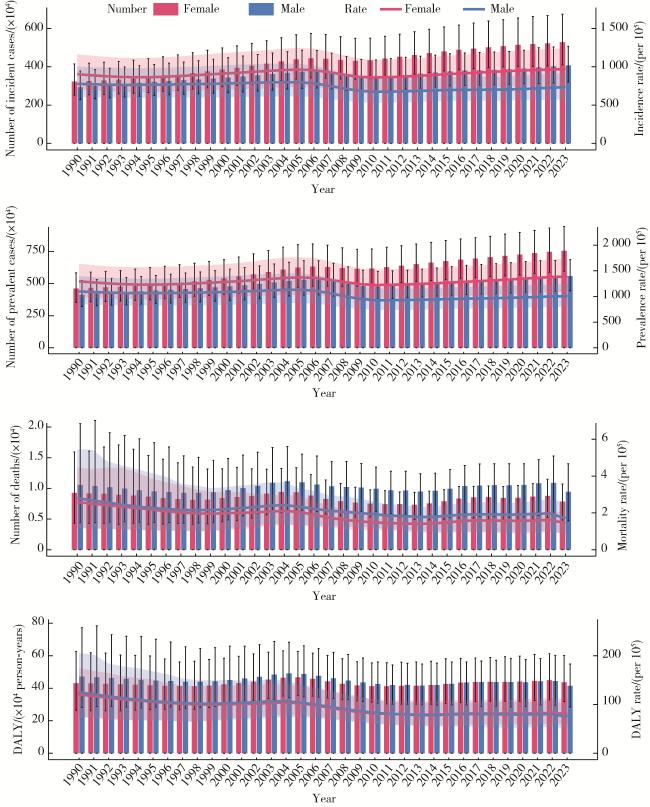
1990—2023年中国GD疾病负担变化详见表 1和图 1。发病方面,1990—2023年我国GD总体发病数从615.88万增至935.45万,发病率从838.88/10万升至851.98/10万,标化发病率则从700.22/10万降至489.05/10万;女性发病数、发病率、标化发病率均高于男性。患病方面,1990—2023年总体患病数从877.06万增至1 314.59万,患病率从1 194.62/10万升至1 197.28/10万,标化患病率则从1 004.91/10万降至678.98/10万;女性患病数、患病率、标化患病率均高于男性。死亡方面,1990—2023年总体死亡数从1.98万降至1.72万,死亡率从2.70/10万降至1.57/10万,标化死亡率从3.02/10万大幅降至0.81/10万;男性死亡数、死亡率、标化死亡率均高于女性。DALY指标中,1990—2023年总体DALY数从90.24万人年降至85.16万人年,DALY率从122.92/10万降至77.56/10万,标化DALY率从118.19/10万降至43.51/10万;男性DALY数与DALY率长期高于女性,近年两指标被女性反超。
表1 1990年和2023年中国GD疾病负担对比Table 1 Comparison of GD burden in China between 1990 and 2023 |
| Indicator | 1990 | 2023 | |||||
| Total | Male | Female | Total | Male | Female | ||
| Incidence | |||||||
| Incident cases/(×104) | 615.88(480.19-794.52) | 292.77(228.67-377.46) | 323.11(252.22-415.37) | 935.45(729.09-1 182.95) | 407.40(319.33-507.83) | 528.04(410.28-675.16) | |
| Incidence rate/(per 105) | 838.88(654.06-1 082.20) | 777.12(606.96-1 001.89) | 903.98(705.67-1 162.10) | 851.98(664.03-1 077.39) | 733.95(575.29-914.87) | 972.65(755.74-1 243.63) | |
| Age-standardized incidence rate/(per 105) | 700.22(551.64-874.14) | 650.80(513.11-810.21) | 750.13(592.28-940.96) | 489.05(391.66-599.60) | 437.47(349.09-529.29) | 541.46(430.51-669.24) | |
| Prevalence | |||||||
| Prevalent cases/(×104) | 877.06(674.68-1 108.67) | 414.01(321.48-525.19) | 463.05(355.15-584.33) | 1 314.59(1 034.83-1 636.95) | 559.05(445.26-687.11) | 755.54(595.71-945.24) | |
| Prevalence rate/(per 105) | 1 194.62(918.97-1 510.08) | 1 098.90(853.32-1 394.02) | 1 295.51(993.63-1 634.80) | 1 197.28(942.49-1 490.87) | 1 007.14(802.15-1 237.84) | 1 391.69(1 097.30-1 741.12) | |
| Age-standardized prevalence rate/(per 105) | 1 004.91(793.38-1 230.01) | 929.54(738.53-1 142.69) | 1 080.74(843.31-1 317.66) | 678.98(544.78-821.73) | 597.67(488.01-720.55) | 761.24(606.68-923.71) | |
| Death | |||||||
| Number of deaths/(×104) | 1.98(1.17-3.28) | 1.05(0.44-2.05) | 0.92(0.43-1.59) | 1.72(1.03-2.31) | 0.94(0.46-1.40) | 0.78(0.48-1.06) | |
| Mortality rate/(per 105) | 2.70(1.59-4.47) | 2.80(1.17-5.45) | 2.59(1.21-4.46) | 1.57(0.94-2.11) | 1.70(0.84-2.52) | 1.45(0.89-1.97) | |
| Age-standardized mortality rate/(per 105) | 3.02(1.78-5.02) | 3.27(1.38-6.12) | 2.73(1.28-4.74) | 0.81(0.49-1.08) | 0.96(0.48-1.38) | 0.67(0.42-0.92) | |
| DALY | |||||||
| DALY/(×104 person-years) | 90.24(61.53-134.31) | 47.11(28.11-77.23) | 43.13(26.52-62.51) | 85.16(63.32-114.63) | 41.49(28.44-54.89) | 43.66(31.83-60.17) | |
| DALY rate/(per 105) | 122.92(83.82-182.95) | 125.05(74.62-205.01) | 120.69(74.21-174.89) | 77.56(57.67-104.41) | 74.75(51.25-98.89) | 80.44(58.65-110.83) | |
| Age-standardized DALY rate/(per 105) | 118.19(81.26-173.20) | 122.01(74.15-195.68) | 113.87(71.70-163.06) | 43.51(31.87-58.47) | 43.58(29.97-57.48) | 43.55(31.14-60.58) | |
Values in parentheses are 95% uncertainty intervals (95%UI). GD, gastritis and duodenitis; DALY, disability-adjusted life year. |
2.2 1990—2023年中国GD标化率的Joinpoint分析
Joinpoint回归模型分析结果显示,标化发病率、标化患病率、标化死亡率、标化DALY率均呈分阶段变化趋势,总体AAPC分别为-1.08%(95%CI: -1.13%~-1.03%)、-1.18%(95%CI: -1.24%~-1.14%)、-3.81%(95%CI: -3.98%~-3.65%)和-2.89%(95%CI: -3.13%~-2.67%)(P均<0.001)。总体标化发病率分为4个时段,各时段均呈显著下降,2005—2010年下降速率最快(APC=-4.02%,95%CI: -4.25%~-3.80%,P<0.001)。总体标化患病率分为5个时段,但仅2000—2005年小幅显著上升(APC=0.20%,95%CI: 0.02%~0.40%,P=0.035),其余时段均显著下降。总体标化死亡率分为7个时段,时段异质性显著,仅1998—2004年变化无统计学意义(P>0.05),其余时段均显著下降,2004—2008年、2021—2023年为高速下降时段。总体标化DALY率分为5个时段,所有时段下降趋势均具有统计学意义,2005—2009年降幅最为显著(APC=-6.68%,95%CI: -7.61%~-5.75%,P<0.001)。性别差异显示,总体、男性和女性人群的标化率均以显著下降为主,女性发病、患病标化率更高,男性死亡、DALY标化率更高(表 2)。
表2 1990—2023年中国GD标化率的Joinpoint分析Table 2 Joinpoint analysis of age-standardized rates of GD in China, 1990-2023 |
| Items | Trend stage | Total | Male | Female | |||||
| Year | APC/% | Year | APC/% | Year | APC/% | ||||
| Age-standardized incidence rate | 1 | 1990-1995 | -0.94*(-1.13 to -0.77) | 1990-2005 | -0.61*(-0.63 to -0.59) | 1990-1994 | -1.49*(-1.61 to -1.39) | ||
| 2 | 1995-2005 | -0.21*(-0.28 to -0.14) | 2005-2010 | -4.42*(-4.55 to -4.29) | 1994-2003 | 0.04*(0.01 to 0.09) | |||
| 3 | 2005-2010 | -4.02*(-4.25 to -3.80) | 2010-2015 | -0.46*(-0.60 to -0.34) | 2003-2006 | -0.44*(-0.78 to -0.11) | |||
| 4 | 2010-2023 | -0.64*(-0.68 to -0.61) | 2015-2020 | -1.02*(-1.15 to -0.90) | 2006-2009 | -4.92*(-5.24 to -4.60) | |||
| 5 | 2020-2023 | -0.05 (-0.27 to 0.15) | 2009-2012 | -1.22*(-1.56 to -0.90) | |||||
| 6 | 2012-2015 | -0.29 (-0.62 to 0.04) | |||||||
| 7 | 2015-2023 | -0.74*(-0.78 to -0.71) | |||||||
| Age-standardized prevalence rate | 1 | 1990-1994 | -1.29*(-1.49 to -1.11) | 1990-2000 | -0.82*(-0.89 to -0.77) | 1990-1994 | -1.56*(-1.76 to -1.37) | ||
| 2 | 1994-2000 | -0.49*(-0.63 to -0.36) | 2000-2005 | -0.01 (-0.24 to 0.23) | 1994-2000 | -0.28*(-0.43 to -0.15) | |||
| 3 | 2000-2005 | 0.20*(0.02 to 0.40) | 2005-2010 | -5.18*(-5.40 to -4.97) | 2000-2005 | 0.43*(0.24 to 0.64) | |||
| 4 | 2005-2010 | -4.54*(-4.73 to -4.37) | 2010-2023 | -0.70*(-0.74 to -0.67) | 2005-2010 | -3.98*(-4.17 to -3.79) | |||
| 5 | 2010-2023 | -0.69*(-0.72 to -0.66) | 2010-2023 | -0.69*(-0.73 to -0.66) | |||||
| Age-standardized mortality rate | 1 | 1990-1998 | -4.29*(-4.52 to -4.08) | 1990-1998 | -4.00*(-4.63 to -3.38) | 1990-1998 | -4.19*(-5.18 to -3.20) | ||
| 2 | 1998-2004 | 0.30 (-0.05 to 0.66) | 1998-2004 | 0.26 (-0.70 to 1.25) | 1998-2005 | -0.72 (-1.86 to 0.42) | |||
| 3 | 2004-2008 | -7.44*(-7.97 to -6.92) | 2004-2013 | -5.81*(-6.16 to -5.48) | 2005-2008 | -10.34*(-14.72 to -5.74) | |||
| 4 | 2008-2013 | -5.75*(-6.06 to -5.44) | 2013-2021 | -1.81*(-2.26 to -1.37) | 2008-2013 | -5.82*(-7.12 to -4.51) | |||
| 5 | 2013-2017 | -1.03*(-1.66 to -0.41) | 2021-2023 | -9.09*(-12.64 to -5.40) | 2013-2017 | -0.44 (-2.74 to 1.90) | |||
| 6 | 2017-2021 | -3.34*(-4.02 to -2.66) | 2017-2023 | -5.04*(-5.87 to -4.21) | |||||
| 7 | 2021-2023 | -7.97*(-9.35 to -6.57) | |||||||
| Age-standardized DALY rate | 1 | 1990-1998 | -3.13*(-3.44 to -2.84) | 1990-1998 | -3.40*(-3.64 to -3.16) | 1990-1998 | -2.94*(-3.14 to -2.74) | ||
| 2 | 1998-2005 | -0.86*(-1.27 to -0.46) | 1998-2004 | -0.44*(-0.85 to -0.03) | 1998-2005 | -0.84*(-1.08 to -0.60) | |||
| 3 | 2005-2009 | -6.68*(-7.61 to -5.75) | 2004-2012 | -5.42*(-5.61 to -5.25) | 2005-2009 | -6.80*(-7.41 to -6.20) | |||
| 4 | 2009-2012 | -4.24*(-6.15 to -2.30) | 2012-2021 | -1.96*(-2.13 to -1.80) | 2009-2012 | -4.01*(-5.36 to -2.65) | |||
| 5 | 2012-2023 | -2.22*(-2.38 to -2.07) | 2021-2023 | -4.35*(-5.88 to -2.80) | 2012-2023 | -2.18*(-2.29 to -2.08) | |||
Values in parentheses are 95% confidence interval (95%CI). * P<0.05. GD, gastritis and duodenitis; APC, annual percent change; DALY, disability-adjusted life year. |
2.3 1990—2023年中国GD发病、患病和死亡风险的年龄-时期-队列分析
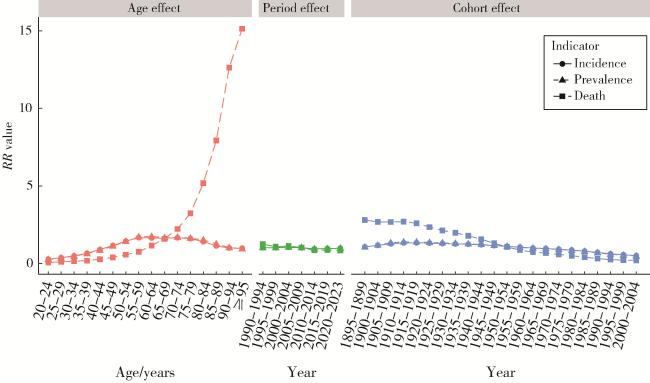
基于1990—2023年中国GD发病、患病和死亡风险的年龄-时期-队列模型,年龄、时期、队列三效应特征差异显著。从年龄效应看,发病风险RR值从20~24岁的0.283(95%CI: 0.281~0.285,P<0.001)逐步升至55~59岁的1.670(95%CI: 1.668~1.672,P<0.001),随后开始回落;患病风险RR值从20~24岁的0.264(95%CI: 0.262~0.265,P<0.001)逐步升至55~59岁的1.720(95%CI: 1.718~1.721,P<0.001),随后开始回落;死亡风险RR值随年龄显著上升,≥95岁达15.138(95%CI: 14.432~15.878,P<0.001)。时期效应层面,发病、患病风险总体先升后降,如发病1990—2004年RR从1.020(95%CI: 1.017~1.022,P<0.001)升至1.050(95%CI: 1.048~1.051,P<0.001),2020—2023年降至0.987(95%CI: 0.985~0.989,P<0.001);1990—1994年死亡风险RR为1.249(95%CI: 1.227~1.272,P<0.001),后逐步下降至2020—2023年的0.844(95%CI: 0.829~0.860,P<0.001)。队列效应方面,发病、患病队列风险呈下降趋势,如1900—1904年出生队列发病风险RR为1.174(95%CI: 1.146~1.203,P<0.001),降至2000—2004年出生队列的0.508(95%CI: 0.504~0.512,P<0.001);1895—1899年出生队列死亡风险RR为2.802(95%CI: 2.327~13.374,P<0.001),降至2000—2004年出生队列的0.200(95%CI: 0.126~0.317,P<0.001,图 2)。
2.4 1990—2023年中国GD负担的分解分析
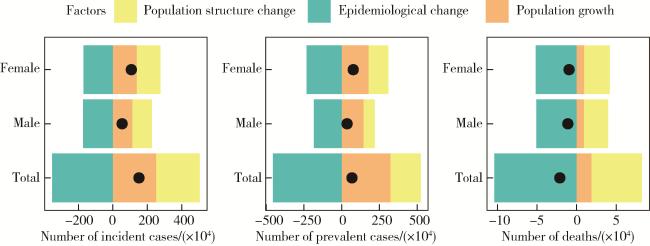
基于人口结构变化、流行病学变化、人口增长三类因素,分解中国GD疾病负担变化的驱动因素。结果表明,对于发病数与患病数,人口增长和人口结构变化是促使其增加的核心因素,以发病数为例,总体人口增长、人口结构变化的贡献占比分别为165.66%、167.00%,男性依次为209.50%、211.50%,女性依次为128.13%、130.07%。流行病学变化是促使发病数、患病数降低的主要力量,发病数总体流行病学变化贡献占比-232.66%,男性-321.00%,女性-158.19%;患病数总体流行病学变化贡献占比-668.19%,男性-513.57%,女性-303.27%。对于死亡数,流行病学变化是促使其减少的核心因素,总体贡献占比490.07%,男性459.63%,女性539.57%。人口结构变化与人口增长是促使死亡数增加的因素,总体人口结构变化、人口增长贡献占比分别为-302.33%、-87.73%,男性依次为-277.26%、-82.38%,女性依次为-341.34%、-98.24%(图 3)。
2.5 2024—2040年中国GD疾病负担的ARIMA分析
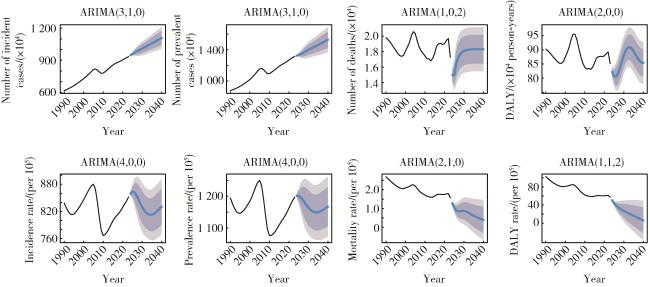
基于1990—2023年中国GD疾病负担数据,构建时间序列ARIMA模型。经检验,数据经差分处理后实现平稳,残差序列为白噪声(Ljung-Box检验无显著自相关),模型拟合优度较高,外推预测具有可信度。预测结果见图 4,到2040年,发病数将升至1 108.61万例(95%CI: 1 008.59~1 208.63),患病数将升至1 527.96万例(95%CI: 1 368.75~1 687.16),死亡数将稳定至1.83万例(95%CI: 1.54~2.11),DALY数将波动至85.40万人年(95%CI: 77.91~92.90);发病率将波动至830.55/10万(95%CI:769.77~891.34),患病率将波动至1 167.39/10万(95%CI:1 072.46~1 262.31),死亡率将降至0.48/10万(95%CI:0.32~1.12),DALY率降至26.18/10万(95%CI: 13.11~41.22)。


3 讨论
基于GBD 2023数据,本研究系统评估了1990—2023年中国GD的疾病负担演变趋势、驱动因素及未来预测。结果显示,中国GD标化疾病负担总体呈现显著下降趋势,但粗发病数与患病例数因人口基数增长与人口老龄化的影响持续上升,未来疾病负担分布将呈现新的特征。这些发现为理解GD流行规律、识别关键人群及制定精准防控策略提供了重要依据。
GD总体疾病负担的变化与性别差异,共同揭示了流行病学转变与医疗进步对其产生的深刻影响。1990—2023年间,中国GD的粗发病数与患病例数分别上升51.9%与49.9%,而标化发病率与标化患病率分别下降30.2%与32.4%,同时标化死亡率与标化DALY率大幅下降73.2%与63.2%。这一“绝对数上升、标化率下降”的趋势表明,疾病负担的演变是人口因素与流行病学变化共同作用的结果。粗率上升主要归因于人口老龄化与人口基数增长,而标化率下降则反映出诊疗水平提升、危险因素控制及公共卫生干预的整体成效。尤其在死亡与健康损失维度,标化DALY率的降幅远超标化发病率(AAPC分别为-2.89%和-1.08%),说明尽管新发病例数量仍在增长,但因GD导致的过早死亡与残疾后果得到了更有效的控制。
究其原因,这一变化可能与多方面因素有关。消化内镜技术的广泛可及使得GD及其前驱病变得以早期识别与干预,幽门螺杆菌根除治疗则可显著降低胃黏膜慢性炎症水平,阻断其向萎缩性胃炎、肠上皮化生乃至胃癌的进展路径;质子泵抑制剂的规范使用有助于控制胃酸相关炎症反应,减少黏膜损伤的反复发作,降低疾病活动度与复发风险[11-13]。性别差异上,女性在发病与患病指标上始终高于男性,2023年女性标化发病率为541.46/10万,显著高于男性的437.47/10万,这一结果可能与女性激素波动影响胃黏膜屏障、免疫反应差异及主动就医比例更高相关[14];而男性在死亡相关指标上持续高于女性,如标化死亡率男性为0.96/10万,女性为0.67/10万,提示男性可能由于吸烟和饮酒比例更高、就医行为更延迟、合并心脑血管疾病更多,导致重症与死亡风险更高[15]。
Joinpoint回归揭示了GD疾病负担变化的阶段性特征。标化发病率与标化患病率在2005—2010年间出现下降(APC分别为-4.02%与-4.54%),可能反映了我国在此期间基层消化疾病诊疗能力建设及幽门螺杆菌筛查项目的推进效果。例如,2005年起全国范围内推广的“胃癌早诊早治项目”将慢性GD纳入高危人群管理,内镜技术的普及显著提升了炎症的早期检出与干预率[16]。而2010年后,各标化率进入平缓下降阶段,提示GD防控从“快速改善期”进入“平台优化期”,疾病负担的进一步降低需依赖更精准的一级预防与长期管理。死亡与DALY指标在2004—2009年间出现加速下降(如标化死亡率APC为-7.44%),可能与该时期质子泵抑制剂药物逐步纳入医保、急诊内镜止血技术成熟应用,大幅降低上消化道出血等致死性并发症发生率有关。2021—2023年标化死亡率再度加速下降(APC=-7.97%),可能与国家药品集采政策落地、幽门螺杆菌根除与抑酸药物可及性进一步提升、内镜微创治疗技术普及有关[17]。
年龄-时期-队列效应指明了不同人群的发病风险特征,从而明确了重点防控人群与关键干预窗口。年龄效应显示,GD发病与患病风险在55~59岁达到高峰(RR=1.670~1.720),此后随年龄增长逐步下降,而死亡风险则随年龄持续攀升,至95岁以上年龄组RR高达15.138。55~59岁人群长期不良饮食、幽门螺杆菌累积暴露、工作压力大等危险因素叠加,可能是发病与患病达峰的核心原因;而高龄人群器官功能衰退、基础疾病多、炎症修复能力下降,导致死亡风险呈指数级上升,需重点加强并发症防控[18]。时期效应层面,GD发病与患病风险在1990—2004年间呈上升趋势,这可能与我国经济快速发展期饮食结构西化、高盐高脂摄入增加、精神压力上升、幽门螺杆菌感染率仍处高位等因素相关[19];2005年后持续下降,可能反映了公共卫生干预与临床诊疗规范的积极作用。死亡风险的时期RR值持续走低,或可反映我国急救体系、消化专科能力、慢病管理水平持续提升,有效改善了疾病预后。出生队列效应呈现一致的下降趋势,越晚的出生队列,其GD发病、患病与死亡风险均越低。以发病风险为例,1900—1904年出生队列RR为1.174,至2000—2004年已降至0.508,这一长期下降趋势或得益于居住卫生条件改善、营养水平提升、儿童幽门螺杆菌感染率下降、抗生素合理使用等多重公共卫生红利累积[20]。
分解分析阐明,GD疾病负担变化源于人口因素与流行病学改善的博弈。对于发病与患病例数的增长,人口增长与人口结构老龄化是主要推动力,两者对发病数增加的合计贡献度超过330%;而流行病学变化则成为抵消上述影响、促使标化率下降的关键力量,其对发病数增加的贡献度为-232.66%。分解结果提示,若没有近30年诊疗水平提升、危险因素控制、幽门螺杆菌防控等积极干预,受人口老龄化驱动,我国GD发病数增幅将显著高于现有规模[21]。死亡数的下降则几乎完全归因于流行病学变化,其贡献度高达490.07%,显著抵消了人口老龄化与增长对死亡数的正向影响,这一结果与Joinpoint中标化死亡率持续下降相互印证,或可说明医疗技术进步与规范化管理是降低GD死亡负担的核心因素。
未来疾病负担预测为精准防控指明了方向。ARIMA模型预测显示,至2040年,中国GD的发病与患病例数将继续攀升至1 108.61万与1 527.96万,该变化主要由人口老龄化加深与人口基数扩大推动;而标化死亡率与DALY率将进一步降至0.48/10万与26.18/10万,表明疾病的严重程度与健康损失将持续缓解。结合本研究年龄、时期、队列及驱动因素结果,未来防控应采取分层精准策略:首先,针对发病风险高峰的55~59岁人群,应推广基于年龄的主动筛查与健康管理,将胃功能检测与幽门螺杆菌筛查纳入常规体检项目,实现早期发现与干预[22]。其次,依托年轻队列风险更低的结果,强化青少年与青年健康教育,推广低盐、低脂、高纤维饮食,戒烟限酒,从源头阻断危险因素暴露[23 - 24]。此外,应继续普及消化内镜技术,提升基层医疗机构对GD及其并发症的诊疗能力,重点优化高龄、男性等预后较差人群的管理策略,进一步缩小性别与年龄间的健康差距。
本研究存在以下局限:(1)GBD数据基于模型估算,虽经多次校正,仍可能存在一定的不确定性;(2)分析时并未纳入地区差异、饮食习惯等具体影响因素,难以全面解释负担分布的内在异质性;(3)ARIMA模型主要依据历史趋势外推,未考虑未来重大政策或技术突破可能带来的影响;(4)受原始数据整合与归类规则限制,本研究无法进一步区分GD的具体临床亚型、病因亚型及严重程度亚型,相关细分维度分析有待未来基于更精细的临床登记与队列数据开展。
综上所述,1990—2023年中国GD标化发病率、标化患病率、标化死亡率及标化DALY率均呈显著下降趋势,疾病负担明显缓解;人口增长与老龄化推动发病、患病绝对数上升,而流行病学改善是标化率下降与死亡风险降低的核心原因。未来GD发病与患病规模将持续增长,但死亡与伤残负担进一步减轻。本研究全面揭示了GD疾病负担的长期趋势、驱动因素与未来态势,可为我国制定分年龄、分人群、分阶段的精准防控策略提供数据支撑,对降低GD疾病负担、防控胃癌上游风险、提升居民消化系统健康水平具有一定的公共卫生意义。