Journal of Peking University (Health Sciences) ›› 2020, Vol. 52 ›› Issue (2): 269-274. doi: 10.19723/j.issn.1671-167X.2020.02.012
Previous Articles Next Articles
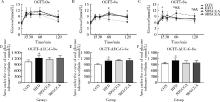
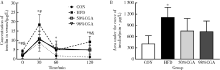
Effects of chlorogenic acid on glucose tolerance and its curve characteristics in high-fat diet-induced obesity rats
Cheng-cheng GUO,Xiao-yuan ZHANG,Ying-xiang YU,Lan XIE,Cui-qing CHANG( )
)
- Institute of Sports Medicine, Peking University Third Hospital, Beijing 100191, China
CLC Number:
- R587.1


| [1] | Wang L, Gao P, Zhang M , et al. Prevalence and ethnic pattern of diabetes and prediabetes in China in 2013[J]. JAMA, 2017,317(24):2515-2523. |
| [2] | Li G, Zhang P, Wang J , et al. Cardiovascular mortality, all-cause mortality, and diabetes incidence after lifestyle intervention for people with impaired glucose tolerance in the da qing diabetes prevention study: a 23-year follow-up study[J]. Lancet Diabetes Endocrinol, 2014,2(6):474-480. |
| [3] | Unwin N, Shaw J, Zimmet P , et al. Impaired glucose tolerance and impaired fasting glycaemia: the current status on definition and intervention[J]. Diabet Med, 2002,19(9):708-723. |
| [4] | Hulman A, Witte DR, Vistisen D , et al. Pathophysiological characteristics underlying different glucose response curves: a latent class trajectory analysis from the prospective EGIR-RISC study[J]. Diabetes Care, 2018,41(8):1740-1748. |
| [5] | Tura A, Morbiducci U, Sbrignadello S , et al. Shape of glucose, insulin, C-peptide curves during a 3-h oral glucose tolerance test: any relationship with the degree of glucose tolerance[J]. Am J Physiol Regul Integr Comp Physiol, 2011,300(4):R941-R948. |
| [6] | Abdul-Ghani MA, Williams K, Defronzo R , et al. Risk of progression to type 2 diabetes based on relationship between postload plasma glucose and fasting plasma glucose[J]. Diabetes Care, 2006,29(7):1613-1618. |
| [7] | Hayashi T, Boyko EJ, Sato KK , et al. Patterns of insulin concentration during the OGTT predict the risk of type 2 diabetes in Japanese Americans[J]. Diabetes Care, 2013,36(5):1229-1235. |
| [8] | Kramer CK, Vuksan V, Choi H , et al. Emerging parameters of the insulin and glucose response on the oral glucose tolerance test: reproducibility and implications for glucose homeostasis in individuals with and without diabetes[J]. Diabetes Res Clin Pract, 2014,105(1):88-95. |
| [9] | Wang X, Zhao X, Zhou R , et al. Delay in glucose peak time during the oral glucose tolerance test as an indicator of insulin resistance and insulin secretion in type 2 diabetes patients[J]. J Diabetes Investig, 2018,9(6):1288-1295. |
| [10] | Kramer CK, Ye C, Hanley AJ , et al. Delayed timing of post-challenge peak blood glucose predicts declining beta cell function and worsening glucose tolerance over time: insight from the first year postpartum[J]. Diabetologia, 2015,58(6):1354-1362. |
| [11] | Kanauchi M, Kimura K, Kanauchi K , et al. Beta-cell function and insulin sensitivity contribute to the shape of plasma glucose curve during an oral glucose tolerance test in non-diabetic individuals[J]. Int J Clin Pract, 2005,59(4):427-432. |
| [12] | Chung ST, Ha J, Onuzuruike AU , et al. Time to glucose peak during an oral glucose tolerance test identifies prediabetes risk[J]. Clin Endocrinol (Oxf), 2017,87(5):484-491. |
| [13] | Li G, Zhang P, Wang J , et al. The long-term effect of lifestyle interventions to prevent diabetes in the China da qing diabetes prevention study: a 20-year follow-up study[J]. Lancet, 2008,371(9626):1783-1789. |
| [14] | Zuniga LY , Aceves-de LMM, Gonzalez-Ortiz M, et al. Effect of chlorogenic acid administration on glycemic control, insulin secretion, and insulin sensitivity in patients with impaired glucose tolerance[J]. J Med Food, 2018,21(5):469-473. |
| [15] | Ma Y, Gao M, Liu D . Chlorogenic acid improves high fat diet-induced hepatic steatosis and insulin resistance in mice[J]. Pharm Res, 2015,32(4):1200-1209. |
| [16] | Jin S, Chang C, Zhang L , et al. Chlorogenic acid improves late diabetes through adiponectin receptor signaling pathways in db/db mice[J]. PLoS One, 2015,10(4):e120842. |
| [17] | Panchal SK, Poudyal H, Waanders J , et al. Coffee extract attenuates changes in cardiovascular and hepatic structure and function without decreasing obesity in high-carbohydrate, high-fat diet-fed male rats[J]. J Nutr, 2012,142(4):690-697. |
| [18] | Hariri N, Thibault L . High-fat diet-induced obesity in animal models[J]. Nutr Res Rev, 2010,23(2):270-299. |
| [19] | Le Floch JP, Escuyer P, Baudin E , et al. Blood glucose area under the curve. Methodological aspects[J]. Diabetes Care, 1990,13(2):172-175. |
| [20] | Tschritter O, Fritsche A, Shirkavand F , et al. Assessing the shape of the glucose curve during an oral glucose tolerance test[J]. Diabetes Care, 2003,26(4):1026-1033. |
| [21] | Wong SK, Chin KY, Suhaimi FH , et al. The effects of a modified high-carbohydrate high-fat diet on metabolic syndrome parameters in male rats[J]. Exp Clin Endocrinol Diabetes, 2018,126(4):205-212. |
| [22] | Joung KH, Ju SH, Kim JM , et al. Clinical implications of using post-challenge plasma glucose levels for early diagnosis of type 2 diabetes mellitus in older individuals[J]. Diabetes Metab J, 2018,42(2):147-154. |
| [1] | Jing CHEN,Rui SHAN,Wucai XIAO,Xiaorui ZHANG,Zheng LIU. Association between self-control and co-occurrence of depressive symptoms and overweight or obesity during adolescence and early adulthood: A ten-year prospective cohort study based on national surveys [J]. Journal of Peking University (Health Sciences), 2024, 56(3): 397-402. |
| [2] | Chu-yun CHEN,Peng-fei SUN,Jing ZHAO,Jia JIA,Fang-fang FAN,Chun-yan WANG,Jian-ping LI,Yi-meng JIANG,Yong HUO,Yan ZHANG. Related factors of endogenous erythropoietin and its association with 10-year risks of cardiovascular disease in a community-based Chinese study [J]. Journal of Peking University (Health Sciences), 2023, 55(6): 1068-1073. |
| [3] | Jing CHEN,Wu-cai XIAO,Rui SHAN,Jie-yun SONG,Zheng LIU. Influence of rs2587552 polymorphism of DRD2 gene on the effect of a childhood obesity intervention: A prospective, parallel-group controlled trial [J]. Journal of Peking University (Health Sciences), 2023, 55(3): 436-441. |
| [4] | Jia-jia DANG,Shan CAI,Pan-liang ZHONG,Ya-qi WANG,Yun-fei LIU,Di SHI,Zi-yue CHEN,Yi-hang ZHANG,Pei-jin HU,Jing LI,Jun MA,Yi SONG. Association of outdoor artificial light at night exposure with overweight and obesity among children and adolescents aged 9 to 18 years in China [J]. Journal of Peking University (Health Sciences), 2023, 55(3): 421-428. |
| [5] | Tao MA,Yan-hui LI,Man-man CHEN,Ying MA,Di GAO,Li CHEN,Qi MA,Yi ZHANG,Jie-yu LIU,Xin-xin WANG,Yan-hui DONG,Jun MA. Associations between early onset of puberty and obesity types in children: Based on both the cross-sectional study and cohort study [J]. Journal of Peking University (Health Sciences), 2022, 54(5): 961-970. |
| [6] | Xiao-yuan ZHANG,Cheng-cheng GUO,Ying-xiang YU,Lan XIE,Cui-qing CHANG. Establishment of high-fat diet-induced obesity and insulin resistance model in rats [J]. Journal of Peking University (Health Sciences), 2020, 52(3): 557-563. |
| [7] | Xiao-na NA,Zhu ZHU,Yang-yang CHEN,Dong-ping WANG,Hao-jie WANG,Yang SONG,Xiao-chuan MA,Pei-yu WANG,Ai-ping LIU. Associations of distribution of time spent in physical activity and sedentary behavior with obesity [J]. Journal of Peking University (Health Sciences), 2020, 52(3): 486-491. |
| [8] | DONG Yan-hui, SONG Yi, DONG Bin, ZOU Zhi-yong, WANG Zheng-he, YANG Zhao-geng, WANG Xi-jie, LI Yan-hui, MA Jun. Association between the blood pressure status and nutritional status among Chinese students aged 7-18 years in 2014: based on the national blood pressure reference for Chinese children and adolescents [J]. Journal of Peking University(Health Sciences), 2018, 50(3): 422-428. |
| [9] | WU Yu-jia, CHI Xiao-pei, CHEN Feng, DENG Xu-liang. Salivary microbiome in people with obesity: a pilot study [J]. Journal of Peking University(Health Sciences), 2018, 50(1): 5-12. |
| [10] | DU Yi-qing, LIU Hui-xin, LIU Chun-lei, DUN Yao-jun, LI Qing, YU Lu-ping, LIU Shi-jun, CHEN Li-li, WANG Xiao-feng, XU Tao. Analysis of metabolic factors and relevance with the grade and stage in patients with renal cell carcinoma [J]. Journal of Peking University(Health Sciences), 2016, 48(4): 612-617. |
| [11] | CHENG Lan, LI Qin, SONG Yi, MA Jun, WANG Hai-Jun. Association of physical activities, sedentary behaviors with overweight/obesity in 9-11 year-old Chinese primary school students [J]. Journal of Peking University(Health Sciences), 2016, 48(3): 436-441. |
| [12] | FU Lian-Guo, WANG Hai-Jun, YANG Yi-De, LI Xiao-Hui, WANG Shuo, MENG Xiang-Kun, WANG Zheng-He, MA Jun. Analysis on awareness of obesity risk factors among children and adolescents [J]. Journal of Peking University(Health Sciences), 2015, 47(3): 410-413. |
| [13] | WEN Meng-Meng, ZHU Guang-Rong, WANG Hai-Xue. Association between obesity and age at spermarche among Chinese Han boys aged 11-18 years [J]. Journal of Peking University(Health Sciences), 2015, 47(3): 406-409. |
| [14] | CUI Xin-Yue, CHEN Tian-Jiao, MA Jun. Effect of obesity intervention with socio-ecological model on anthropometric measurements of children and adolescents [J]. Journal of Peking University(Health Sciences), 2015, 47(3): 400-405. |
| [15] | LIU Yan, QI Li-Tong, MA Wei, YANG Ying, MENG Lei, ZHANG Bao-Wei, HUO Yong. Correlation between anthropometric parameters and arteriosclerosis biomarker in the middle-aged and the elderly [J]. Journal of Peking University(Health Sciences), 2014, 46(3): 455-459. |
|
||