Journal of Peking University (Health Sciences) ›› 2020, Vol. 52 ›› Issue (3): 479-485. doi: 10.19723/j.issn.1671-167X.2020.03.013

Previous Articles     Next Articles

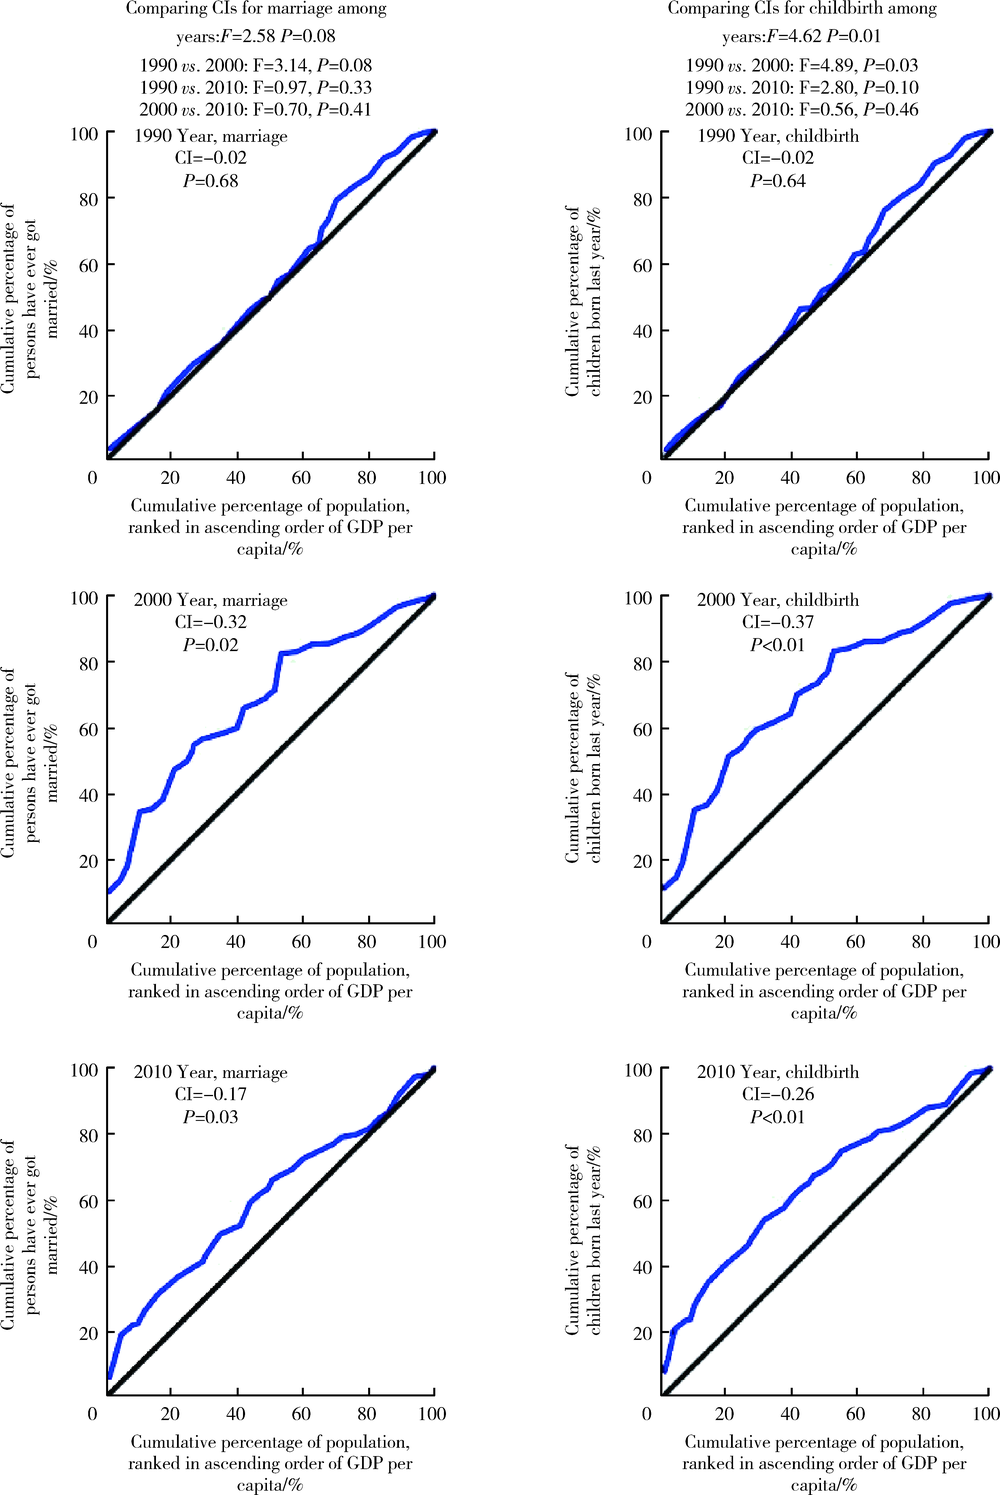
Subnational inequalities of early marriage and fertility among Chinese females from 1990 to 2010

Dong-mei LUO,Xiao-jin YAN,Pei-jin HU,Jing-shu ZHANG,Yi SONG(),Jun MA   

  1. Institute of Child and Adolescent Health, Peking University, Beijing 100191, China
  • Received:2020-02-08 Online:2020-06-18 Published:2020-06-30
  • Contact: Yi SONG E-mail:songyi@bjmu.edu.cn
  • Supported by:
    Humanities and Social Sciences Planning Fund Project, Ministry of Education, People’s Republic of China(19YJA890022)

Abstract:

Objective: To analyze the inequality of early marriage and adolescent fertility with respect to local economic development among Chinese females aged 15-19 years from 1990 to 2010.Methods: Aggregated data were extracted from the Chinese National Census from 1990 to 2010. We calculated the ever-married rate and fertility rate of female adolescents aged 15-19 years. Using gross domestic product (GDP) per capita as an indicator for socio-economic status of a province, we calculated the slope index of inequality (SII) and the concentration index (CI) to analyze the subnational inequalities of early marriage and adolescent fertility. Weighted linear regression models were also established to assess the associations between GDP per capita and the ever-married rate/fertility rate.Results: The ever-married rate for Chinese female adolescents aged 15-19 years decreased from 4.7% in 1990 to 1.2% in 2000, and rebounded to 2.1% in 2010. From 1990 to 2000, the fertility rate decreased from 22.0 per 1 000 to 6.0 per 1 000, and further decreased to 5.9 per 1 000 in 2010. In 1990, the socio-economic inequalities of the ever-married rate and fertility rate for female adolescents aged 15-19 years were not statistically significant (P for SII or CI>0.05). The values of SII revealed that, in 2000 and 2010, female adolescents with the lowest GDP per capita had an ever-married rate 2.4% (95%CI: 0.4-4.4) and 2.3% (95%CI: 0.3-4.2) higher than those with the highest GDP per capita, respectively. In the meantime, in 2000 and 2010, female adolescents with the lowest GDP per capita had a fertility rate 12.9 per 1 000 (95%CI: 5.4-20.5) and 9.3 per 1 000 (95%CI: 4.6-14.0) higher than those with the highest, respectively. In 2000 and 2010, the CIs for marriage were -0.32 (P=0.02) and -0.17 (P=0.03), respectively, and the CIs for childbirth were -0.37 (P<0.01) and -0.26 (P<0.01), respectively. In 2000, the ever-married rate and the fertility rate were estimated to increase by 1.4% (95%CI: 0.1-2.7) and 7.9 per 1 000 (95%CI: 2.9-12.8) with 100% increase in GDP per capita, respectively; in 2010, the numbers were 1.5% (95%CI: 0.1-2.9) and 6.7 per 1 000 (95%CI: 3.2-10.1), respectively.Conclusion: Subnational socio-economic inequality of early marriage and adolescent fertility existed in 2000 and 2010. Female adolescents residing in less-developed areas were more likely to engage in early marriage and childbirth. Reducing income inequality and increasing education investment for poverty-stricken areas seem to be effective measures to reduce this inequality.

Key words: Early marriage, Adolescent fertility, Inequality, Subnational economic development

CLC Number: 

  • R169.1

Table 1

Sample sizes for the marriage and childbirth status for female adolescents aged 15-19 years by province, from 1990 to 2010"

Province 1990 2000 2010
Marriage Childbirth Marriage Childbirth Marriage Childbirth
Beijing 371 171 418 625 56 073 58 753 46 295 54 720
Tianjin 319 791 343 387 40 897 40 872 33 629 38 326
Hebei 2 693 731 2 907 918 315 002 308 904 247 048 265 951
Shanxi 1 483 226 1 519 173 124 167 121 065 159 640 161 499
Inner Mongolia 1 200 786 1 216 356 95 561 93 902 73 553 75 906
Liaoning 1 738 583 1 838 419 136 254 138 264 116 486 122 820
Jilin 1 246 136 1 330 586 90 647 89 767 75 599 81 577
Heilongjiang 1 946 956 1 978 893 125 823 124 764 97 709 104 446
Shanghai 344 530 380 268 61 100 62 675 52 686 61 454
Jiangsu 2 853 893 3 151 132 236 732 235 252 252 105 273 913
Zhejiang 1 869 963 1 984 223 158 967 159 812 169 565 179 519
Anhui 3 136 569 3 331 470 186 674 180 933 202 180 206 905
Fujian 1 613 736 1 646 617 147 704 143 054 121 840 131 464
Jiangxi 2 171 052 279 439 106 848 99 410 146 352 154 131
Shandong 4 134 972 4 405 858 356 913 350 144 233 869 257 038
Henan 4 572 670 4 732 014 340 810 334 200 333 702 359 055
Hubei 2 631 616 2 810 951 181 901 173 085 186 398 197 852
Hunan 3 130 405 3 246 147 204 373 195 046 168 315 182 827
Guangdong 3 218 213 3 416 531 441 954 464 301 128 267 462 923
Guangxi 2 114 553 2 093 109 181 908 171 526 142 064 142 331
Hainan 315 462 327 599 33 421 33 263 35 396 36 182
Chongqing NA NA 67 332 63 917 90 949 89 807
Sichuan 6 806 378 6 893 796 206 340 198 409 290 965 291 021
Guizhou 1 958 504 1 882 092 117 832 113 548 124 923 120 412
Yunnan 2 126 355 2 106 799 156 091 153 951 163 239 164 866
Tibet 106 878 109 314 12 283 12 225 10 772 10 866
Shaanxi 1 665 154 308 120 132 943 126 899 144 349 152 149
Gansu 1 307 575 1 407 251 90 869 87 808 120 533 121 375
Qinghai 273 954 280 743 18 715 18 926 22 607 22 766
Ningxia 272 072 276 497 24 072 24 072 25 130 25 475
Xinjiang 882 948 931 681 86 475 85 883 81 456 84 811
Total 58 507 832 57 555 008 4 536 681 4 464 625 4 097 621 4 634 387

Table 2

Inequalities associated with GDP per capita on the marriage and childbirth of female adolescents, from 1990 to 2010"

Items Overall Guizhoua Shanghaia Rate difference Rate ratio SII
-SII (95%CI) P
Ever-married rate
1990 4.7 5.6 0.8 4.9 7.4 0.8(-2.1, 3.6) 0.581
2000 1.2 5.0 0.7 4.2 6.7 2.4(0.4, 4.4) 0.018
2010 2.1 4.8 3.1 1.7 1.5 2.3(0.3, 4.2) 0.023
Fertility rate
1990 22.0 24.5 4.0 20.5 6.1 3.1(-7.7, 13.9) 0.560
2000 6.0 26.8 1.6 25.2 16.9 12.9(5.4, 20.5) 0.002
2010 5.9 19.0 4.1 15.0 4.7 9.3(4.6, 14.0) <0.001

Figure 1

Concentration indexes and concentration curves of the marriage and childbirth for female adolescents aged 15-19 years, from 1990 to 2010 CI, concentration index; GDP, gross domestic product."

Table 3

Associations of adolescent marriage and childbirth with GDP per capita in China, from 1990 to 2010"

Item n logGDP logGDP×year
β(95%CI)a P
Ever-married rate
1990 30 -1.1(-3.5, 1.3) 0.345 Reference
2000 31 -1.4(-2.7, -0.1) 0.031 P=0.876
2010 31 -1.5(-2.9, -0.1) 0.040 P=0.877
Fertility rate
1990 30 -5.2(-14.0, 3.7) 0.241 Reference
2000 31 -7.9(-12.8, -2.9) 0.003 P=0.708
2010 31 -6.7(-10.1, -3.2) <0.001 P=0.852
[1] United Nations. Sustainable Development Goals[EB/OL]. [2019-04-09]. https://www.un.org/sustainabledevelopment/gender-equality/.
[2] Azzopardi PS, Hearps SJC, Francis KL, et al. Progress in adolescent health and wellbeing: tracking 12 headline indicators for 195 countries and territories, 1990-2016[J]. Lancet, 2019,393(10176):1101-1118.
pmid: 30876706
[3] Viner RM, Ozer EM, Denny S, et al. Adolescence and the social determinants of health[J]. Lancet, 2012,379(9826):1641-1652.
pmid: 22538179
[4] Patton GC, Sawyer SM, Santelli JS, et al. Our future: a Lancet commission on adolescent health and wellbeing[J]. Lancet, 2016,387(10036):2423-2478.
[5] 国务院人口普查办公室, 国家统计局人口统计司. 中国1990年人口普查资料(第三册)[M]. 北京: 中国统计出版社, 1993: 98-136, 568.
[6] 国务院人口普查办公室, 国家统计局人口和社会科技统计司. 中国2000年人口普查资料(下册)[M]. 北京: 中国统计出版社, 2002: 1618-1677, 1700.
[7] 国务院人口普查办公室, 国家统计局人口和就业统计司. 中国2010年人口普查资料(下册)[M]. 北京: 中国统计出版社, 2012: 1862-1925, 2036.
[8] 中华人民共和国国家统计局. 国家数据[EB/OL]. [ 2019- 05- 01]. http://data.stats.gov.cn/easyquery.htm?cn=E0103.
[9] Mackenbach JP, Stirbu I, Roskam AJ, et al. Socioeconomic inequalities in health in 22 European countries[J]. N Engl J Med, 2008,358(23):2468-2481.
[10] Mackenbach JP, Kunst AE. Measuring the magnitude of socio-economic inequalities in health: an overview of available measures illustrated with two examples from Europe[J]. Soc Sci Med, 1997,44(6):757-771.
[11] Wagstaff A, Paci P, Van Doorslaer E. On the measurement of inequalities in health[J]. Soc Sci Med, 1991,33(5):545-557.
pmid: 1962226
[12] Pamuk ER. Social class inequality in mortality from 1921 to 1972 in England and Wales[J]. Popul Stud, 1985,39(1):17-31.
[13] Wagstaff A. The bounds of the concentration index when the vari-able of interest is binary, with an application to immunization inequality[J]. Health Econ, 2005,14(4):429-432.
pmid: 15495147
[14] Marphatia AA, Ambale GS, Reid AM. Women’s marriage age matters for public health: A review of the broader health and social implications in South Asia[J]. Front Public Health, 2017,5:269.
[15] Nguyen PH, Scott S, Neupane S, et al. Social, biological, and programmatic factors linking adolescent pregnancy and early childhood undernutrition: a path analysis of India’s 2016 National Family and Health Survey[J]. Lancet Child Adolesc Health, 2019,3(7):463-473.
[16] Gausman J, Langer A, Austin SB, et al. Contextual variation in early adolescent childbearing: A multilevel study from 33,822 communities in 44 low- and middle-income countries[J]. J Adolesc Health, 2019,64(6):737-745.
[17] 江涛, 刘俊林, 付俊. 云南麻栗坡县猛硐瑶族乡农业人口早婚状况调查[J]. 文山师范高等专科学校学报, 2009,22(4):23-26, 57.
[18] Chao F, Gerland P, Cook AR, et al. Systematic assessment of the sex ratio at birth for all countries and estimation of national imba-lances and regional reference levels[J]. Proc Natl Acad Sci USA, 2019,116(19):9303-9311.
pmid: 30988199
[19] Guilmoto CZ. Skewed sex ratios at birth and future marriage squeeze in China and India, 2005—2100[J]. Demography, 2012,49(1):77-100.
[20] Jiang Q, Feldman MW, Li S. Marriage squeeze, never-married proportion, and mean age at first marriage in China[J]. Popul Res Policy Rev, 2014,33:189-204.
[21] GBD 2017 Population and Fertility Collaborators. Population and fertility by age and sex for 195 countries and territories, 1950—2017: a systematic analysis for the Global Burden of Disease Study 2017BD 2017 Population and Fertility Collaborators. Population and fertility by age and sex for 195 countries and territories, 1950—2017: a systematic analysis for the Global Burden of Disease Study 2017[J]. Lancet, 2018,392(10159):1995-2051.
pmid: 30496106
[22] Santelli JS, Song X, Garbers S, et al. Global trends in adolescent fertility, 1990—2012, in relation to national wealth, income inequalities, and educational expenditures[J]. J Adolesc Health, 2017,60(2):161-168.
[23] 史薇. 中国与瑞典中小学教育经费管理的比较研究[D]. 广西: 广西师范大学教育学部, 2018.
[24] Wang D, Chi G. Different places, different stories: A study of spatial heterogeneity of county-level fertility in China[J]. Demogr Res, 2017,37:493-526.
[25] Morgan SP, Guo ZG, Hayford SR. China's below-replacement fertility: Recent trends and future prospects[J]. Popul Dev Rev, 2009,35(3):605-629.
No related articles found!
Viewed
Full text


Abstract

Cited

  Shared   
  Discussed   
[1] . [J]. Journal of Peking University(Health Sciences), 2009, 41(4): 456 -458 .
[2] . [J]. Journal of Peking University(Health Sciences), 2009, 41(2): 125 -128 .
[3] . [J]. Journal of Peking University(Health Sciences), 2009, 41(2): 135 -140 .
[4] . [J]. Journal of Peking University(Health Sciences), 2009, 41(2): 158 -161 .
[5] . [J]. Journal of Peking University(Health Sciences), 2009, 41(2): 217 -220 .
[6] . [J]. Journal of Peking University(Health Sciences), 2009, 41(1): 52 -55 .
[7] . [J]. Journal of Peking University(Health Sciences), 2009, 41(1): 109 -111 .
[8] . [J]. Journal of Peking University(Health Sciences), 2009, 41(3): 297 -301 .
[9] . [J]. Journal of Peking University(Health Sciences), 2009, 41(5): 599 -601 .
[10] . [J]. Journal of Peking University(Health Sciences), 2009, 41(5): 516 -520 .