Journal of Peking University (Health Sciences) ›› 2020, Vol. 52 ›› Issue (3): 521-526. doi: 10.19723/j.issn.1671-167X.2020.03.019
Previous Articles Next Articles
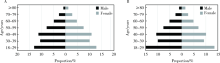
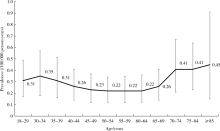
Calculation of the prevalence of progressive muscular atrophy among adults in China based on urban medical insurance data from 15 provinces
Lu XU1,Lu CHEN2,Dong-sheng FAN2,Jing-nan FENG1,Li-li LIU1,Si-yan ZHAN1,3,Sheng-feng WANG1,△( )
)
- 1. Department of Epidemiology and Biostatistics, Peking University School of Public Health, Beijing 100191, China
2. Department of Neurology, Peking University Third Hospital, Beijing 100191, China
3. Research Center of Clinical Epidemiology, Peking University Third Hospital, Beijing 100191, China
CLC Number:
- R195.4


| [1] | Liewluck T, Saperstein DS. Progressive muscular atrophy[J]. Neurol Clin, 2015,33(4):761-773. |
| [2] |
Fowler WS, Miller RD, Mulder DW, et al. Exertional dyspnea: a primary complaint in unusual cases of progressive muscular atrophy and amyotrophic lateral sclerosis[J]. Ann Intern Med, 1957,46(1):119-125.
pmid: 13395221 |
| [3] | Logroscino G, Piccininni M, Marin B, et al. Global, regional, and national burden of motor neuron diseases 1990—2016: a systematic analysis for the Global Burden of Disease Study 2016[J]. Lancet Neurol, 2018,17(12):1083-1097. |
| [4] | Xu L, Liu T, Liu L, et al. Global variation in prevalence and incidence of amyotrophic lateral sclerosis: a systematic review and meta-analysis[J]. J Neurol, 2020,267(4):944-953. |
| [5] |
Pinho AC, Goncalves E. Are amyotrophic lateral sclerosis caregi-vers at higher risk for health problems?[J]. Acta Med Port, 2016,29(1):56-62.
pmid: 26926900 |
| [6] | Tsai CP, Wang KC, Hwang CS, et al. Incidence, prevalence, and medical expenditures of classical amyotrophic lateral sclerosis in Taiwan, 1999—2008[J]. J Formos Med Assoc, 2015,114(7):612-619. |
| [7] | Riku Y, Atsuta N, Yoshida M, et al. Differential motor neuron involvement in progressive muscular atrophy: a comparative study with amyotrophic lateral sclerosis[J]. BMJ Open, 2014,4(5):e005213. |
| [8] |
Kim WK, Liu X, Sandner J, et al. Study of 962 patients indicates progressive muscular atrophy is a form of ALS[J]. Neurology, 2009,73(20):1686-1692.
pmid: 19917992 |
| [9] | 王胜锋, 詹思延, 许璐, 等. 基于医保数据的单病种诊断信息快速结构化方法: 中国, CN109344250A [P]. 2019-02-15. |
| [10] |
Xu L, Chen L, Wang S, et al. Incidence and prevalence of amyotrophic lateral sclerosis in urban China: a national population-based study[J]. J Neurol Neurosurg Psychiatry, 2020,91(5):520-525.
pmid: 32139654 |
| [11] | Noubiap JJ, Nansseu JR, Nyaga UF, et al. Global prevalence of diabetes in active tuberculosis: a systematic review and meta-analysis of data from 2.3 million patients with tuberculosis[J]. Lancet Glob Health, 2019,7(4):e448-e460. |
| [12] |
Leigh PN, Ray-Chaudhuri K. Motor neuron disease[J]. J Neurol Neurosurg Psychiatry, 1994,57(8):886-896.
pmid: 8057109 |
| [13] | Chio A, Brignolio F, Leone M, et al. A survival analysis of 155 cases of progressive muscular atrophy[J]. Acta Neurol Scand, 1985,72(4):407-413. |
| [14] |
Maragakis NJ. Motor neuron disease: progressive muscular atrophy in the ALS spectrum[J]. Nat Rev Neurol, 2010,6(4):187-188.
pmid: 20379201 |
| [15] | Marin B, Boumediene F, Logroscino G, et al. Variation in worldwide incidence of amyotrophic lateral sclerosis: a meta-analysis[J]. Int J Epidemiol, 2017,46(1):57-74. |
| [16] | 邢志宏, 叶植材. 中国统计年鉴 [M]. 北京: 中国统计出版社, 2017: 31. |
| [17] | Cui F, Liu M, Chen Y, et al. Epidemiological characteristics of motor neuron disease in Chinese patients[J]. Acta Neurol Scand, 2014,130(2):111-117. |
| [18] | Wicks P, Abrahams S, Leigh PN, et al. Absence of cognitive, behavioral, or emotional dysfunction in progressive muscular atrophy[J]. Neurology, 2006,67(9):1718-1719. |
| [19] |
Chen L, Zhang B, Chen R, et al. Natural history and clinical features of sporadic amyotrophic lateral sclerosis in China[J]. J Neurol Neurosurg Psychiatry, 2015,86(10):1075-1081.
pmid: 26124198 |
| [20] | Smoyer-Tomic KE, Amato AA, Fernandes AW. Incidence and prevalence of idiopathic inflammatory myopathies among commercially insured, medicare supplemental insured, and medicaid enrolled populations: an administrative claims analysis[J]. BMC Musculoskelet Disord, 2012,13:103. |
| [21] | Ki M, Choi HY, Kim KA, et al. Incidence, prevalence and complications of Budd-Chiari syndrome in South Korea: a nationwide, population-based study[J]. Liver Int, 2016,36(7):1067-1073. |
| [22] |
Rhee C, Dantes R, Epstein L, et al. Incidence and trends of sepsis in US hospitals using clinical vs claims data, 2009—2014[J]. JAMA, 2017,318(13):1241-1249.
doi: 10.1001/jama.2017.13836 pmid: 28903154 |
| [23] |
Donnachie E, Schneider A, Mehring M, et al. Incidence of irritable bowel syndrome and chronic fatigue following GI infection: a population-level study using routinely collected claims data[J]. Gut, 2018,67(6):1078-1086.
pmid: 28601847 |
| [1] | Yuanyuan ZENG,Yun XIE,Daonan CHEN,Ruilan WANG. Related factors of euthyroid sick syndrome in patients with sepsis [J]. Journal of Peking University (Health Sciences), 2024, 56(3): 526-532. |
| [2] | Qiang FU,Guan-ying GAO,Yan XU,Zhuo-hua LIN,You-jing SUN,Li-gang CUI. Comparative study of ultrasound and magnetic resonance imaging in the diagnosis of asymptomatic anterosuperior acetabular labrum tears [J]. Journal of Peking University (Health Sciences), 2023, 55(4): 665-669. |
| [3] | Yong-wei LIN,Ya-lin ZHOU,Run-long ZHAO,Ya-jun XU,Yan-ping LIU. Analysis on the iron status and associated factors during the first trimester of pregnancy [J]. Journal of Peking University (Health Sciences), 2023, 55(4): 600-605. |
| [4] | WU Jun-hui,CHEN Hong-bo,WU Yi-qun,WU Yao,WANG Zi-jing,WU Tao,WANG Meng-ying,WANG Si-yue,WANG Xiao-wen,WANG Jia-ting,YU Huan,HU Yong-hua. Prevalence and risk factors of osteoarthritis in patients with type 2 diabetes in Beijing, China from 2015 to 2017 [J]. Journal of Peking University (Health Sciences), 2021, 53(3): 518-522. |
| [5] | Yan GENG,Zhi-bo SONG,Xiao-hui ZHANG,Xue-rong DENG,Yu WANG,Zhuo-li ZHANG. Depression and anxiety in patients with psoriatic arthritis: Prevalence and associated factors [J]. Journal of Peking University (Health Sciences), 2020, 52(6): 1048-1055. |
| [6] | Si-wei DENG,Ze-yi CHEN,Zhi-ke LIU,Jian WANG,Lin ZHUO,Shuang-qing GAO,Jia-kuo YU,Si-yan ZHAN. Epidemiological study of bone and joint injury based on urban medical insurance database [J]. Journal of Peking University (Health Sciences), 2020, 52(3): 527-534. |
| [7] | SHI Hui-feng, ZHANG Jing-xu, ZHANG Rong, WANG Xiao-li. Prevalence of autism spectrum disorders in children aged 0-6 years in China: a meta-analysis [J]. Journal of Peking University(Health Sciences), 2017, 49(5): 798-806. |
| [8] | LI Heng, HUANG Yue-Qin, MA Ya-Ting, LIU Zhao-Rui. Descriptive epidemiological study on disabilities attributed to non-dementia organic mental disorder in China [J]. Journal of Peking University(Health Sciences), 2014, 46(2): 247-253. |
| [9] | PANG Ming-Fan, FENG Xing-Lin. Analysis on urban elderly people’s preference for prevention and treatment of non-communicable diseases [J]. Journal of Peking University(Health Sciences), 2014, 46(2): 220-225. |
|
||