Journal of Peking University (Health Sciences) ›› 2021, Vol. 53 ›› Issue (5): 907-914. doi: 10.19723/j.issn.1671-167X.2021.05.016

Previous Articles     Next Articles

Effects of visual restoration on dynamic plantar pressure features in elder individuals

AO Ming-xin1,LI Xue-min1,YU Yuan-yuan2,SHI Hui-juan2,HUANG Hong-shi2,AO Ying-fang2,(),WANG Wei1,()   

  1. 1. Department of Ophthalmology, Beijing Key Laboratory of Restoration of Damaged Ocular Nerve, Peking University Third Hospital, Beijing 100191, China
    2. Department of Sports Medicine, Peking University Third Hospital, Institute of Sports Medicine of Peking University, Beijing Key Laboratory of Sports Injuries, Beijing 100191, China
  • Received:2021-06-21 Online:2021-10-18 Published:2021-10-11
  • Contact: Ying-fang AO,Wei WANG E-mail:aoyingfang@163.com;puh3_ww@bjmu.edu.cn
  • Supported by:
    National Natural Science Foundation of China(81600760)

Abstract:

Objective: To analyze the effects of visual restoration after cataract surgery on plantar pressure and biomechanics of foot in elder individuals. Methods: Thirty-two patients [male/female 5/27, (70.1±5.2) years old] with age-related cataract were recruited between October 2016 and December 2019. The footscan system was employed to record the data of plantar pressure during level walking before and 1-month after the cataract surgery. Parameters of peak pressure (PP), impulse (I), pressure-time integral (PTI) and time to peak pressure (TPP) from the regions of the 1st toe (T1), 2nd to 5th toes (T2-5), 1st to 5th metatarsal heads (M1-M5), midfoot (MF), medial hindfoot (HM) and lateral hindfoot (HL) were analyzed respectively. Results: Post-operatively, the visual function was effectively reconstructed with improved visual acuity in both eyes (Z=-4.878, -4.801; P<0.001). The PP (t=2.266, P=0.031) and I (t=2.152, P=0.039) values in M2 region on the dominant side (right foot) increased statistically at post-operative phase, while the changes of pressure and temporal para-meters in other regions remained stable. There was laterality in plantar pressure at pre-operative phase, manifested as greater PP values in M1, M2, MF, and HM regions on the dominant sides (t=-2.414, -2.478, -2.144, -5.269; P<0.05), greater PP values in T1, M3, M5 and HL regions on the non-dominant sides (t=4.830, 3.155, 2.686, 3.683; P<0.05), greater I values in M1, MF, and HM regions on the dominant sides (t=-2.380, -2.185, -5.320; P<0.05) and greater I values in T1, M3, M5 and HL regions on the non-dominant sides (t=4.489, 2.247, 2.838, 3.992; P<0.05). post-operatively, the pressure tended to be compatible between the two sides in regions of M3 and MF, while the magnitude of laterality in regions of M1 (ZPP△= -2.721, P=0.007; ZI△=-2.581, P=0.010), M2 (ZPP△=-2.674, P=0.007; ZI△=-2.375, P=0.018) and M5 (ZPP△=1.991, P=0.046; ZI△=2.150, P=0.032) was further increased. Conclusion: Changes in plantar pressure after cataract surgery were characterized as increased pressure in the 2nd metatarsal head area on the dominant side. Visual restoration might intensify the laterality in the medial of forefoot on the dominant side and the lateral of forefoot on the non-dominant side.

Key words: Plantar pressure, Phacoemulsification, Intraocular lenses, Elderly

CLC Number: 

  • R779.66

Table 1

Comparisons on the foot plantar parameters during walking before and after cataract surgery"

Region Peak pressure/Pa Impulse/(N·s) Pressure-time integral/ms Time to peak pressure/ms
Pre Post Pre Post Pre Post Pre Post
Right
T1 12.29±8.34 15.00±13.14 1.72±1.54 1.81±1.60 257.58±98.41 257.15±97.69 573.32±68.59 557.16±73.95
T2-5 8.80±5.39 11.18±14.17 1.28±0.95 1.41±1.50 274.67±84.43 274.30±85.01 544.06±57.90 541.12±78.84
M1 18.04±17.98# 22.30±16.38# 3.38±3.77# 3.62±2.28# 329.98±96.98 366.86±113.45 476.36±81.76 484.58±62.21
M2 42.23±23.54# 53.21±35.40*# 8.23±4.25 9.35±5.12*# 456.13±75.14 473.87±76.89 527.40±57.66 531.61±54.87
M3 34.61±16.69 39.21±28.57 8.01±4.14 8.37±4.96 493.03±65.69 494.59±94.12 492.18±80.69 493.91±81.62
M4 19.00±9.06 19.71±10.31 5.19±2.70 5.06±2.28 478.58±83.60 487.28±90.20 384.22±104.04 407.37±86.51
M5 17.06±13.91 16.73±26.41 3.98±3.67 3.53±5.32 417.25±111.72 400.27±110.28 367.32±95.94 359.51±87.39
MF 7.41±5.81# 8.09±6.39 1.26±0.96# 1.32±1.03 263.21±102.64 277.05±124.64 241.83±75.39 258.38±88.58
HM 32.11±14.90# 32.03±13.36# 6.13±3.30# 5.79±2.39# 332.53±68.28 339.23±66.49 115.77±47.10 117.22±56.30
HL 22.48±8.07 23.97±10.60 3.96±1.90 4.25±2.16 307.33±66.38 318.30±71.01 109.78±45.26 121.68±57.11
Left
T1 22.36±14.67§ 25.38±32.47 3.17±2.20§ 3.14±3.49§ 320.41±95.61 319.49±97.18 559.19±58.78 552.11±60.83
T2-5 11.78±11.57 9.02±6.84 1.42±1.35 1.23±0.97 267.42±79.14 278.37±105.46 546.95±83.11 542.03±87.51
M1 11.18±10.13 10.42±12.00 1.89±1.45 1.61±1.45 331.78±96.31 322.01±117.12 439.69±75.67 434.98±84.19
M2 31.88±19.29 31.63±25.32 7.10±5.16 6.47±4.49 460.20±88.77 449.79±99.68 496.31±63.91 487.39±67.69
M3 44.94±22.68§ 44.88±26.58 9.70±4.75§ 9.67±5.14 492.33±80.13 496.21±85.76 509.09±70.78 499.95±76.05
M4 22.56±12.49 21.05±13.07 5.30±3.20 5.20±3.22 470.07±87.55 472.73±106.23 456.42±85.32 445.14±90.23
M5 22.72±15.43§ 28.56±26.07§ 5.47±3.86§ 6.81±6.09§ 471.53±70.56 471.04±79.10 384.60±85.31 376.78±71.24
MF 5.68±3.04 7.74±8.49 0.96±0.66 1.14±0.83 263.60±108.42 271.62±116.15 259.16±83.47 253.90±69.96
HM 20.02±8.52 20.72±7.43 3.64±1.96 3.51±1.50 322.58±66.61 314.03±70.68 104.24±47.81 100.36±57.65
HL 27.48±10.52§ 31.10±13.82§ 5.18±2.30§ 5.32±2.46§ 328.528±66.66 322.72±61.31 103.00±51.11 90.68±52.94

Figure 1

Laterality of plantar pressure before and after cataract surgery Red, with higher pressure in the specific region in comparison between the right side and the left side. A, laterality at pre-operative phase; B, laterality at post-operative phase. T1, 1st toe; T2-5, 2nd to 5th toe; M1 to M5, 1st to 5th metatarsal heads; MF, midfoot; HM, heel medial; HL, heel lateral."

Table 2

Comparisons on the magnitude of laterality before and after cataract surgery"

Region PP/Pa I/(N·s)
Pre Post Pre Post
T1 -6.4 (-19.1, -1.1) -3.4 (-15.4, 0.5) -1.0 (-2.5, -0.3) -0.7 (-1.9, -0.2)
T2-5 -0.2 (-5.4, 3.3) -0.5 (-3.8, 3.3) 0.2 (-1.1, 0.4) 0.0 (-0.6, 0.5)
M1 3.0 (-2.3, 13.8) 8.2 (1.2, 17.4)* 0.7 (-0.5, 2.1) 1.4 (0.3, 3.5)*
M2 6.5 (-4.6, 20.6) 10.2 (0.8, 38.9)* 1.5 (-1.0, 3.3) 1.8 (0.2, 5.8)*
M3 -7.8 (-15.2, -1.1) -8.3 (-19.4, 4.6) -1.8 (-4.0, 0.8) -1.3 (-4.6, 1.5)
M4 -2.8 (-10.1, 3.1) -0.4 (-6.9, 3.4) 0.0 (-2.2, 1.8) 0.0 (-1.6, 0.9)
M5 -5.3 (-11.0, -0.4) -6.8 (-25.2, -2.7)* -1.6 (-2.7, -0.3) -2.1 (-5.6, -1.0)*
MF 0.9 (-0.6, 3.9) 1.4 (-1.0, 4.4) 0.1 (-0.2, 0.5) 0.2 (-0.3, 0.8)
HM 9.6 (4.5, 18.6) 10.2 (0.8, 17.8) 2.2 (0.8, 4.2) 2.0 (0.8, 3.6)
HL -4.7 (-11.4, 0.0) -7.1 (-15.8, 0.0) -1.0 (-2.3, 0.0) -0.8 (-2.2, -0.1)

Figure 2

The effects of cataract surgery on the magnitude of plantar pressure laterality Red, higher magnitude of laterality at the specific region in comparison between the pre- and post-operative phases. T1, 1st toe; T2-5, 2nd to 5th toe; M1 to M5, 1st to 5th metatarsal heads; MF, midfoot; HM, heel medial; HL, heel lateral."

[1] Studenski S, Perera S, Patel K, et al. Gait speed and survival in older adults [J]. JAMA, 2011, 305(1):50-58.
doi: 10.1001/jama.2010.1923
[2] Cuevas-Trisan R. Balance problems and fall risks in the elderly [J]. Phys Med Rehabil Clin N Am, 2017, 28(4):727-737.
doi: S1047-9651(17)30053-0 pmid: 29031339
[3] Rietdyk S, Rhea CK. Control of adaptive locomotion: effect of visual obstruction and visual cues in the environment [J]. Exp Brain Res, 2006, 169(2):272-278.
doi: 10.1007/s00221-005-0345-y
[4] Saucedo F, Yang F. Effects of visual deprivation on stability among young and older adults during treadmill walking [J]. Gait Posture, 2017, 54:106-111.
doi: 10.1016/j.gaitpost.2017.03.001
[5] Dhital A, Pey T, Stanford MR. Visual loss and falls: a review [J]. Eye (Lond), 2010, 24(9):1437-1446.
doi: 10.1038/eye.2010.60 pmid: 20448666
[6] Tricco AC, Thomas SM, Veroniki AA, et al. Comparisons of interventions for preventing falls in older adults: a systematic review and meta-analysis [J]. JAMA, 2017, 318(17):1687-1699.
doi: 10.1001/jama.2017.15006
[7] Deshpande N, Metter EJ, Lauretani F, et al. Activity restriction induced by fear of falling and objective and subjective measures of physical function: a prospective cohort study [J]. J Am Geriatr Soc, 2008, 56(4):615-620.
doi: 10.1111/j.1532-5415.2007.01639.x pmid: 18312314
[8] Ayaki M, Nagura T, Toyama Y, et al. Motor function benefits of visual restoration measured in age-related cataract and simulated patients: case-control and clinical experimental studies [J]. Sci Rep, 2015, 5:14595.
doi: 10.1038/srep14595
[9] Ayaki M, Muramatsu M, Negishi K, et al. Improvements in sleep quality and gait speed after cataract surgery [J]. Rejuvenation Res, 2013, 16(1):35-42.
doi: 10.1089/rej.2012.1369
[10] Durmus B, Emre S, Cankaya C, et al. Gain in visual acuity after cataract surgery improves postural stability and mobility [J]. Bratisl Lek Listy, 2011, 112(12):701-705.
[11] Duman F, Kilic Z, Ozcan-Eksi EE. Impact of cataract surgery on functional balance skills of adults [J]. Turk J Ophthalmol, 2019, 49(5):243-249.
[12] Schwartz S, Segal O, Barkana Y, et al. The effect of cataract surgery on postural control [J]. Invest Ophthalmol Vis Sci, 2005, 46(3):920-924.
doi: 10.1167/iovs.04-0543
[13] Chylack LT Jr, Wolfe JK, Singer DM, et al. The lens opacities classification system Ⅲ. The longitudinal study of cataract study group [J]. Arch Ophthalmol, 1993, 111(6):831-836.
doi: 10.1001/archopht.1993.01090060119035
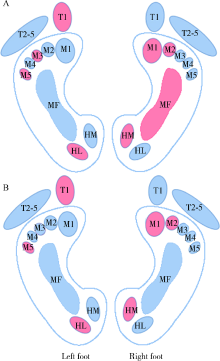
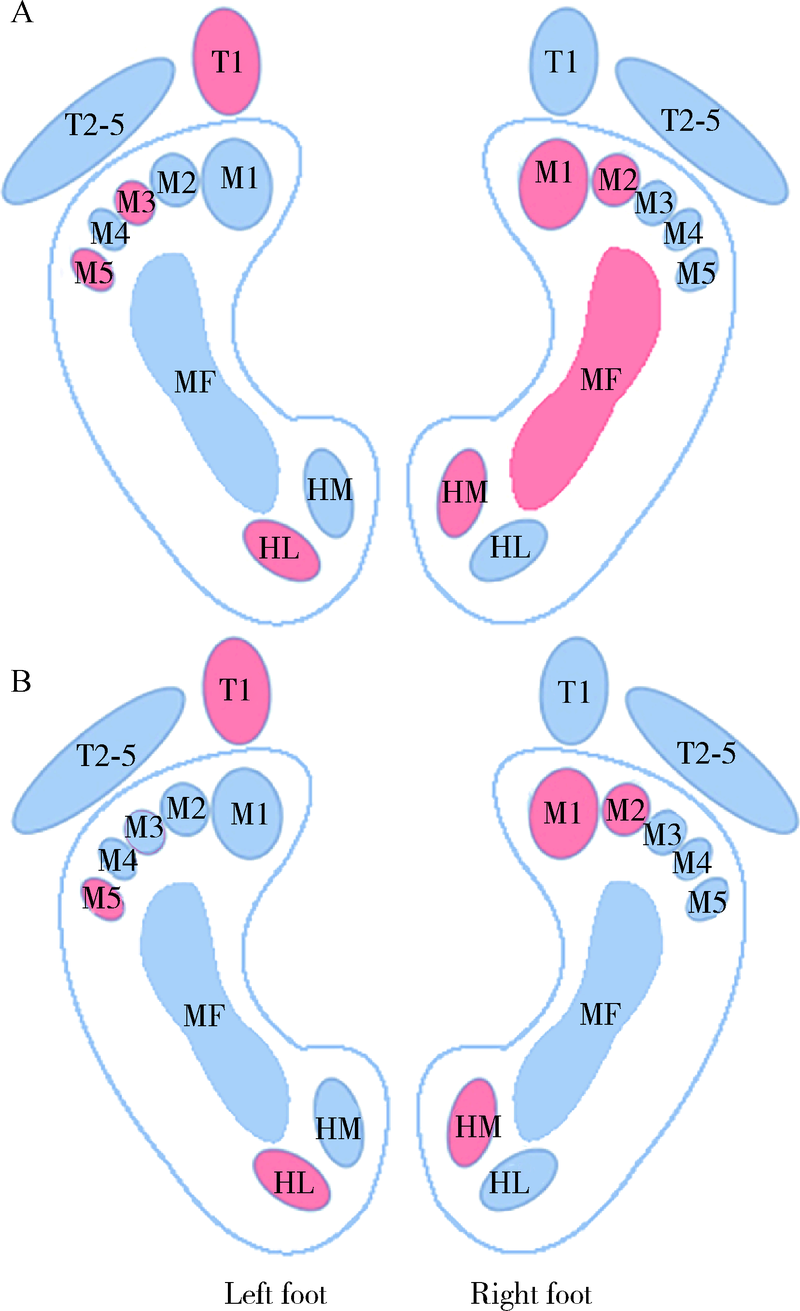
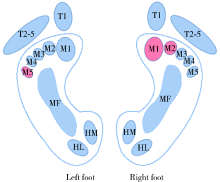
[14] 朱婷, 马霞, 翟华, 等. 踝关节不同应力位的动态足底压力特征 [J]. 医用生物力学, 2020, 35(40):342-348.
[15] Koldenhoven RM, Feger MA, Fraser JJ, et al. Surface electromyography and plantar pressure during walking in young adults with chronic ankle instability [J]. Knee Surg Sports Traumatol Arthrosc, 2016, 24(4):1060-1070.
doi: 10.1007/s00167-016-4015-3
[16] Snijders AH, van de Warrenburg BP, Giladi N, et al. Neurological gait disorders in elderly people: clinical approach and classification [J]. Lancet Neurol, 2007, 6(1):63-74.
pmid: 17166803
[17] Guedes RC, Dias RC, Pereira LS, et al. Influence of dual task and frailty on gait parameters of older community-dwelling individuals [J]. Braz J Phys Ther, 2014, 18(5):445-452.
doi: S1413-35552014000500445 pmid: 25372007
[18] Sainburg RL. Handedness: differential specializations for control of trajectory and position [J]. Exerc Sport Sci Rev, 2005, 33(4):206-213.
pmid: 16239839
[19] Denyer JR, Hewitt NL, Mitchell AC. Foot structure and muscle reaction time to a simulated ankle sprain [J]. J Athl Train, 2013, 48(3):326-330.
doi: 10.4085/1062-6050-48.2.15
[20] Buldt AK, Allan JJ, Landorf KB, et al. The relationship between foot posture and plantar pressure during walking in adults: a systematic review [J]. Gait Posture, 2018, 62:56-67.
doi: 10.1016/j.gaitpost.2018.02.026
[21] Catan L, Amaricai E, Onofrei RR, et al. The impact of overweight and obesity on plantar pressure in children and adolescents: a systematic review [J/OL]. Int J Environ Res Public Health, 2020, 17(18):6600(2020-09-10)[2021-05-01]. http://doi.org/10.3390/ijerph17186600 .
[22] Peters M. Footedness: asymmetries in foot preference and skill and neuropsychological assessment of foot movement [J]. Psychol Bull, 1988, 103(2):179-192.
pmid: 3283813
[23] Seidler RD, Bernard JA, Burutolu TB, et al. Motor control and aging: links to age-related brain structural, functional, and biochemical effects [J]. Neurosci Biobehav Rev, 2010, 34(5):721-733.
doi: 10.1016/j.neubiorev.2009.10.005
[1] Jian CHEN,Cai-hong ZUO,Cai-yi ZHANG,Ming YANG,Pei-xun ZHANG. Comparison of the effects of two cephalomedullary nails (zimmer natural nail and proximal femoral nail antirotation) in treatment of elderly intertrochan teric fractures [J]. Journal of Peking University(Health Sciences), 2019, 51(2): 283-287.
Viewed
Full text


Abstract

Cited

  Shared   
  Discussed   
[1] Author. English Title Test[J]. Journal of Peking University(Health Sciences), 2010, 42(1): 1 -10 .
[2] . [J]. Journal of Peking University(Health Sciences), 2009, 41(2): 188 -191 .
[3] . [J]. Journal of Peking University(Health Sciences), 2009, 41(3): 376 -379 .
[4] . [J]. Journal of Peking University(Health Sciences), 2007, 39(3): 319 -322 .
[5] . [J]. Journal of Peking University(Health Sciences), 2007, 39(3): 333 -336 .
[6] . [J]. Journal of Peking University(Health Sciences), 2007, 39(3): 337 -340 .
[7] . [J]. Journal of Peking University(Health Sciences), 2007, 39(3): 225 -328 .
[8] . [J]. Journal of Peking University(Health Sciences), 2007, 39(4): 346 -350 .
[9] . [J]. Journal of Peking University(Health Sciences), 2007, 39(4): 351 -354 .
[10] . [J]. Journal of Peking University(Health Sciences), 2007, 39(4): 369 -373 .