Journal of Peking University (Health Sciences) ›› 2022, Vol. 54 ›› Issue (3): 477-482. doi: 10.19723/j.issn.1671-167X.2022.03.012

Previous Articles     Next Articles

Analysis of variation trend in health workforce equity allocation in China

Wu-ping ZHOU1,Shu-han YANG2,Nan MU3,Wei-yan JIAN1,*()   

  1. 1. Department of Health Policy and Management, Peking University School of Public Health, Beijing 100191, China
    2. Peking University School of Public Health, Beijing 100191, China
    3. Zhongwei Institute of Nursing Information, Beijing 100086, China
  • Received:2022-02-22 Online:2022-06-18 Published:2022-06-14
  • Contact: Wei-yan JIAN E-mail:jianweiyan@bjmu.edu.cn
  • Supported by:
    National Natural Science Foundation of China(72174007)

RICH HTML


Abstract:

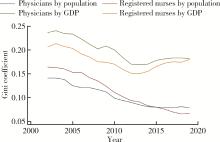
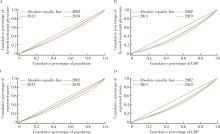
Objective: To analyze the long-term trends of the changes in the equity of China's health workforce allocation to provide a reference for the more balanced and orderly development of China's health system. Methods: The Gini coefficient was used to evaluate the degree of equity in the allocation of health workforce between regions, and the Gini coefficients for the allocation of doctors and nurses based on population and regional gross domestic product (GDP) distribution were calculated respectively. Results: In 2019, the number of licensed (assistant) physicians per 1 000 population in China was 2.77, and the number of registered nurses per 1 000 population was 3.18. The Gini coefficient for the distribution of licensed (assistant) physicians by population was 0.141 in 2002, decreasing to 0.081 by 2014 and then remained stable. The Gini coefficient for the distribution of registered nurses by population was 0.164 in 2002 and decreased to 0.066 in 2018. The Gini coefficient for the distribution of licensed (assistant) physicians by GDP was 0.236 in 2002, decreased to 0.169 in 2013, then increased to 0.183 and remained stable. The Gini coefficient for the distribution of registered nurses by GDP was 0.206 in 2002, decreased to 0.150 in 2013, and then increased each year to 0.180 in 2019. The equity of the allocation of registered nurses by population was worse than the equity of the allocation of licensed (assistant) physicians in 2002, and in 2016, for the first time, exceeded that of licensed (assistant) physicians. Conclusion: Equity in the allocation of health workforce across China has improved, but the improvement in equity between regions has hit a bottleneck, with health workforce allocation in the western regions still relatively scarce. Although nursing workforce allocation equity caught up with licensed (assistant) physicians, the number of licensed (assistant) physicians is close to that of developed western countries, while there is a large gap in registered nurses. It is recommended that the relevant authorities make good long-term planning for health workforce, further increase the policy for the introduction of health workforce in the western region, and increase the supply of healthcare services in the western region with the help of digital transformation of healthcare and internet healthcare. At the same time, they should further increase investment in resources for higher nursing education and actively plan to cope with the ageing population.

Key words: Health manpower, Health care rationing, Gini coefficient

CLC Number: 

  • R192

Table 1

Trends in the number of health workforce in China, 2002-2019"

Year Number of health technicians (×104) Number of health technicians per 1 000 population Doctor-nurse ratio
Licensed (assistant) physician Registered nurse Licensed (assistant) physician Registered nurse
2002 184.4 124.7 1.47 1.00 1:0.68
2003 194.2 126.6 1.53 1.00 1:0.65
2004 199.9 130.8 1.57 1.03 1:0.65
2005 204.2 135.0 1.56 1.03 1:0.66
2006 209.9 142.6 1.60 1.09 1:0.68
2007 212.3 155.9 1.61 1.18 1:0.73
2008 220.2 167.8 1.66 1.27 1:0.76
2009 232.9 185.5 1.75 1.39 1:: 0.80
2010 241.3 204.8 1.80 1.53 1:0.85
2011 246.6 224.4 1.82 1.66 1:0.91
2012 261.6 249.7 1.94 1.85 1:0.95
2013 279.5 278.3 2.04 2.04 1:1.00
2014 289.3 300.4 2.12 2.20 1:1.04
2015 303.9 324.1 2.22 2.37 1:1.07
2016 319.1 350.7 2.31 2.54 1:1.10
2017 339.0 380.4 2.44 2.74 1:1.12
2018 360.7 409.9 2.59 2.94 1:1.14
2019 386.7 444.5 2.77 3.18 1:1.15

Figure 1

Change in the Gini coefficient for health workforce allocation, 2002-2019"

Table 2

Licensed (assistant) physicians and nurses per 1 000 population by province in 2002, 2013, 2019"

Province Region Number of licensed (assistant) physician per 1 000 population Number of registered nurse per 1 000 population
2002 2013 2019 2002 2013 2019
Beijing East 3.32 3.63 4.83 2.73 3.95 5.25
Shanghai East 2.55 2.37 3.01 2.16 2.78 3.74
Zhejiang East 1.57 2.39 3.22 0.99 2.29 3.45
Shandong East 1.44 2.38 3.12 1.00 2.46 3.38
Jiangsu East 1.38 2.07 3.01 0.98 2.13 3.30
Hainan East 1.48 1.82 2.40 1.22 2.27 3.22
Guangxi East 1.07 1.76 2.31 0.85 2.00 3.06
Tianjin East 2.65 2.27 3.35 1.96 2.11 2.99
Guangdong East 1.17 1.87 2.33 0.97 1.93 2.85
Fujian East 1.28 1.87 2.40 0.91 2.06 2.81
Hebei East 1.44 2.06 3.07 0.74 1.53 2.48
Liaoning North-east 2.14 2.37 2.90 1.69 2.37 3.25
Jilin North-east 2.10 2.32 3.23 1.46 1.98 3.24
Heilongjiang North-east 1.70 2.20 2.87 1.20 2.02 3.00
Hunan Middle 1.31 1.93 2.87 0.82 1.90 3.62
Hubei Middle 1.54 2.02 2.59 1.15 2.21 3.28
Shanxi Middle 1.99 2.49 3.02 1.15 2.12 3.12
Henan Middle 1.06 1.89 2.54 0.72 1.84 2.82
Anhui Middle 1.00 1.65 2.27 0.67 1.73 2.68
Jiangxi Middle 1.14 1.57 2.14 0.84 1.75 2.67
Shaanxi West 1.63 1.96 2.76 1.00 2.35 3.81
Ningxia West 1.72 2.15 2.89 1.18 2.10 3.39
Yunnan West 1.19 1.61 2.42 0.80 1.58 3.36
Inner Mongolia West 2.05 2.53 3.23 1.08 2.13 3.33
Sichuan West 1.43 2.14 2.65 0.74 1.95 3.24
Chongqing West 1.34 1.83 2.61 0.73 1.84 3.24
Qinghai West 1.79 2.32 2.95 1.08 2.01 3.21
Gansu West 1.37 1.77 2.50 0.88 1.61 3.17
Guizhou West 0.95 1.54 2.33 0.55 1.62 3.15
Xinjiang West 1.99 2.32 2.65 1.48 2.48 3.02
Xizang West 1.63 1.63 2.58 0.61 0.76 1.66

Figure 2

Lorentz curve for the allocation of national licensed (assistant) physicians and registered nurses (by population and GDP) A, distribution of licensed (assistant) physicians by population; B, distribution of licensed (assistant) physicians by GDP; C, distribution of registered nurses by population; D, distribution of registered nurses by GDP."

1 邱卓英, 郭键勋, 杨剑, 等. 康复2030:促进实现《联合国2030年可持续发展议程》相关目标[J]. 中国康复理论与实践, 2017, 23 (4): 373- 378.
doi: 10.3969/j.issn.1006-9771.2017.04.001
2 中国共产党中央委员会, 中华人民共和国国务院. "健康中国2030"规划纲要[J]. 中国实用乡村医生杂志, 2017, 24 (7): 1- 12.
doi: 10.3969/j.issn.1672-7185.2017.07.002
3 孙新章. 中国参与2030年可持续发展议程的战略思考[J]. 中国人口·资源与环境, 2016, 26 (1): 1- 7.
doi: 10.3969/j.issn.1002-2104.2016.01.001
4 周靖. 中国居民健康不平等的经济社会影响因素研究[D]. 武汉: 华中科技大学, 2013.
5 李立清, 许荣. 中国居民健康水平的区域差异分析[J]. 卫生经济研究, 2015, (1): 14- 20.
6 孙菊. 中国卫生财政支出的健康绩效及其地区差异——基于省级面板数据的实证分析[J]. 武汉大学学报(哲学社会科学版), 2011, 64 (6): 75- 80.
7 李海明, 王有强. 卫生资源投入与健康中国建设: 基于价值的卫生系统视角[J]. 中国行政管理, 2018, (8): 65- 69.
doi: 10.3782/j.issn.1006-0863.2018.08.09
8 程立辉, 柏亚妹, 宋玉磊, 等. 基于集聚度的我国护理人力资源配置分析[J]. 中国医院管理, 2018, 38 (10): 69- 71.
9 黄燕, 孙蓉, 朱鹏瞻, 等. 基于资源同质性假设的护理人力资源配置现状及公平性分析[J]. 中国医院管理, 2021, 41 (5): 83- 86.
10 苏彬彬, 杜鹃, 贾金忠, 等. 中国护理人力资源现状及其配置研究[J]. 中国卫生政策研究, 2018, 11 (12): 60- 65.
11 杨展, 李宁秀. 2013—2017年我国护理人力资源配置现状及公平性研究[J]. 现代预防医学, 2021, 48 (5): 858- 861.
12 张小娟, 朱坤. 2004—2015年我国卫生人力资源配置公平性趋势研究[J]. 中国全科医学, 2018, 21 (1): 82- 87.
doi: 10.3969/j.issn.1007-9572.2018.01.018
13 黄阿红, 方鹏骞, 陶思羽, 等. 2011年和2016年我国护理人力资源配置公平性比较研究[J]. 中国卫生经济, 2018, 37 (1): 70- 73.
14 国家卫生健康委员会. 中国卫生统计年鉴[EB/OL]. (2019-06-13)[2021-10-20]. http://www.nhc.gov.cn/mohwsbwstjxxzx/tjzxtjcbw/tjsj_list.shtml.
15 中国知网. 中国经济社会大数据研究平台[EB/OL]. (2021-02-01)[2021-10-20]. https://data.cnki.net/Yearbook/Single/N2020020200.
16 国家统计局. 国家数据中心[EB/OL]. (2021)[2021-10-20]. https://data.stats.gov.cn/.
17 龚红娥. 基尼系数及其实际应用[J]. 市场与人口分析, 2002, 8 (6): 35- 40.
doi: 10.3969/j.issn.1674-1668.2002.06.007
18 叶礼奇. 基尼系数计算方法[J]. 中国统计, 2003, (4): 60.
doi: 10.3969/j.issn.1002-4557.2003.04.036
19 洪兴建. 基尼系数合意值和警戒线的探讨[J]. 统计研究, 2007, 24 (8): 84- 87.
20 赵红, 王小合, 应心, 等. Lorenz曲线和Gini系数在卫生资源配置公平性评价应用中的几个问题与思考[J]. 中国卫生经济, 2012, 31 (4): 25- 27.
21 O'Donnell O , O'Neill S , van Ourti T , et al. Conindex: Estimation of concentration indices[J]. Stata J, 2016, 16 (1): 112- 138.
22 万广华. 不平等的度量与分解[J]. 经济学(季刊), 2008, 8 (1): 347- 368.
23 毛宗福, 王永棣, 刘继强, 等. 我国卫生人力资源及其研究现状[J]. 中华医院管理杂志, 2003, 19 (1): 16- 20.
24 夏冕, 罗五金. 我国卫生人力资源配置的公平性分析[J]. 医学与社会, 2009, 22 (2): 36- 38.
25 中共中央办公厅. 中共中央办公厅国务院办公厅关于印发《西部地区人才开发十年规划》的通知[EB/OL]. (2002-02-10)[2022-03-14]. https://rsj.sh.gov.cn/tgwyxzfgwj_17255/20200617/t0035_1388242.htm.
26 中共中央国务院. 中共中央国务院关于新时代推进西部大开发形成新格局的指导意见[EB/OL]. (2020-07-02)[2022-03-14]. http://www.gov.cn/zhengce/2020-05/17/content_5512456.htm.
27 杨辉, 韩建军, 许岩丽. 中国全科医生队伍建设的发展、挑战与展望[J]. 中国全科医学, 2019, 22 (19): 2267- 2279.
28 朱劲松. 互联网+医疗模式: 内涵与系统架构[J]. 中国医院管理, 2016, 36 (1): 38- 40.
29 中华人民共和国国民经济和社会发展第十四个五年规划和2035年远景目标纲要[J]. 中国水利, 2021(6): 1-38.
30 WHO. Global health workforce statistics database[EB/OL]. (2022-01-24)[2022-05-16]. https://www.who.int/data/gho/data/themes/topics/health-workforce.
31 中华人民共和国国务院办公厅. 关于推动公立医院高质量发展的意见[EB/OL]. (2021-06-04)[2022-03-15]. http://www.gov.cn/zhengce/content/2021-06/04/content_5615473.htm.
32 穆楠, 周吴平, 霍珊珊, 等. 1990年至2019年我国护理人力资源变化趋势分析[J]. 中华医院管理杂志, 2021, 37 (10): 848- 851.
33 鲁晓明, 孙喆. 我国长期护理保险制度的构建[J]. 江汉论坛, 2022, (3): 108- 115.
No related articles found!
Viewed
Full text


Abstract

Cited

  Shared   
  Discussed   
No Suggested Reading articles found!