
1 资料与方法
1.1 研究设计与伦理
1.2 研究对象
1.3 研究变量
1.3.1 主要暴露变量
1.3.2 主要结局指标
1.3.3 协变量
1.3.4 数据核查
1.4 统计学方法
2 结果
2.1 研究对象基线特征
表1 藏族住院患者基线特征Table 1 Baseline characteristics by sex in Tibetan inpatients |
| Variables | Total (n=3 083) | Male (n=1 450) | Female (n=1 633) | P |
| Age/years, $\bar x \pm s$ | 45.0±14.6 | 47.3±14.1 | 43.0±14.7 | < 0.001 |
| BMI/(kg/m2), $\bar x \pm s$ | 23.8±4.2 | 23.5±4.0 | 24.1±4.4 | < 0.001 |
| Hypertension, n(%) | 275 (8.9) | 107 (7.4) | 168 (10.3) | 0.005 |
| Diabetes, n(%) | 46 (1.5) | 26 (1.8) | 20 (1.2) | 0.194 |
| Smoking history, n(%) | 441 (14.3) | 419 (28.9) | 22 (1.3) | < 0.001 |
| Alcoholism, n(%) | 503 (16.3) | 408 (28.1) | 95 (5.8) | < 0.001 |
| Comorbid pulmonary disease, n(%) | 1 505 (48.8) | 729 (50.3) | 776 (47.5) | 0.127 |
| Hemoglobin/(g/dL), $\bar x \pm s$ | 15.5±2.5 | 16.8±2.1 | 14.4±2.2 | < 0.001 |
| SpO2 at rest/%, M (P25, P75) | 90.0 (88.0, 91.0) | 90.0 (88.0, 91.0) | 90.0 (88.0, 91.0) | 0.121 |
| SpO2 at rest<88%, n(%) | 615 (19.9) | 268 (18.5) | 347 (21.2) | 0.055 |
BMI, body mass index; SpO2, pulse oxygen saturation. |
2.2 女性血红蛋白水平与静息SpO2的关联分析
表2 藏族住院患者血红蛋白与静息脉搏氧饱和度关联性的多因素线性回归分析(按性别分层)Table 2 Multivariable linear regression analysis of the association between hemoglobin and pulse oxygen saturation at rest in Tibetan female and male inpatients |
| Items | Crude coefficient (95%CI) | Crude P value | Adjusted coefficient (95%CI) | Adjusted P value |
| Female | -0.141 (-0.211 to -0.066) | < 0.001 | -0.081 (-0.149 to 0.004) | 0.038 |
| Male | -0.184 (-0.255 to -0.113) | < 0.001 | -0.124(-0.202 to -0.047) | 0.002 |
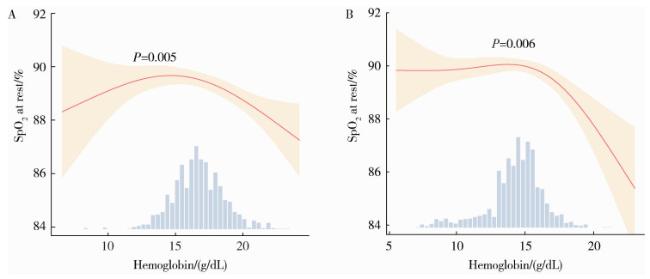


图1 藏族女性(A)和男性(B)住院患者血红蛋白与静息SpO2的非线性关联Figure 1 Non-linear association between hemoglobin and SpO2 at rest in Tibetan female (A) and male (B) inpatients Adjusted for age, body mass index, hypertension, diabetes, smoking history, alcoholism, comorbid pulmonary disease. The solid red curve depicts the fitted non-linear association, with the surrounding shaded area representing the 95% confidence interval. The lower panel displays the histogram of hemoglobin concentration distribution within the sample. SpO2, pulse oxygen saturation. |
表3 藏族住院患者血红蛋白对静息脉搏氧饱和度影响的阈值效应分析Table 3 Threshold effect analysis of hemoglobin on pulse oxygen saturation at rest in Tibetan inpatients |
| Gender | Hemoglobin | n | Coefficient (95%CI) | P value |
| Female | < 15.482 g/dL | 1 164 | -0.021 (-0.121, 0.080) | 0.688 |
| ≥15.482 g/dL | 469 | -0.477 (-0.760, -0.193) | 0.001 | |
| Likelihood ratio test | < 0.001 | |||
| Male | < 17.288 g/dL | 904 | 0.032 (-0.099, 0.163) | 0.634 |
| ≥17.288 g/dL | 546 | -0.344 (-0.550, -0.138) | 0.001 | |
| Likelihood ratio test | < 0.001 |
Adjusted for age, body mass index, hypertension, diabetes, smoking history, alcoholism, comorbid pulmonary disease. Coefficient represents change in pulse oxygen saturation per 1 g/dL hemoglobin increase. |