
1 资料与方法
1.1 研究设计、数据来源与研究对象
1.2 变量定义
1.3 统计学处理与质量控制
2 结果
2.1 研究样本特征
表1 主分析样本特征(未加权)Table 1 Characteristics of the main analytic sample (unweighted) |
| Variable | 2012 | 2022 | Pooled sample (6 survey waves) | P value |
| Records | 23 716 | 13 707 | 135 986 | |
| Unique individuals | 23 716 | 13 707 | 34 010 | |
| Female, n(%) | 12 265 (51.72) | 6 740 (49.17) | 68 094 (50.07) | < 0.001 |
| Age, ${\bar x}$±s | 46.61±15.64 | 47.31±16.08 | 47.17±16.23 | < 0.001 |
| Education levela, ${\bar x}$±s | 0.74±0.92 | 1.22±1.10 | 0.92±1.01 | < 0.001 |
| Married/cohabiting, n(%) | 19 686 (83.01) | 10 484 (76.49) | 108 156 (79.54) | < 0.001 |
| Urban residence, n(%) | 10 557 (44.72) | 7 311 (53.39) | 65 472 (48.79) | < 0.001 |
| Eastern region, n(%) | 8 789 (37.06) | 5 009 (36.54) | 49 833 (36.65) | 0.321 |
| Central region, n(%) | 5 123 (21.60) | 2 914 (21.26) | 28 390 (20.88) | 0.443 |
| Western region, n(%) | 6 259 (26.39) | 3 836 (27.99) | 38 544 (28.34) | < 0.001 |
| Northeastern region, n(%) | 3 543 (14.94) | 1 948 (14.21) | 19 215 (14.13) | 0.057 |
| Household income per capita (median, CNY) | 8 228.00 | 23 000.00 | 13 460.00 | < 0.001 |
| Low-income group, n(%) | 8 092 (37.26) | 4 400 (33.12) | 47 316 (36.01) | < 0.001 |
| Middle-income group, n(%) | 7 131 (32.83) | 4 501 (33.88) | 44 178 (33.63) | 0.045 |
| High-income group, n(%) | 6 497 (29.91) | 4 386 (33.01) | 39 889 (30.36) | < 0.001 |
| Insured, n(%) | 20 870 (88.22) | 12 557 (92.97) | 122 932 (90.99) | < 0.001 |
| Agricultural hukou, n(%) | 17 025 (71.91) | 9 728 (71.14) | 98 477 (72.55) | 0.118 |
| Self-rated healthb, ${\bar x}$±s | 3.21±1.20 | 2.91±1.18 | 3.05±1.22 | < 0.001 |
| Any chronic disease, n(%) | 3 160 (13.33) | 2 317 (16.91) | 22 435 (16.50) | < 0.001 |
| Number of chronic diseases, ${\bar x}$±s | 0.16±0.45 | 0.34±0.75 | 0.25 ± 0.60 | < 0.001 |
| Hospitalization in past 12 months, n(%) | 2 121 (8.94) | 1 501 (10.95) | 15 361 (11.30) | < 0.001 |
Categorical variables were compared using Pearson Chi-square tests; continuous or ordinal variables were compared using rank-sum tests. P values compare 2012 and 2022. a, education level: 0=primary school or below, 1=junior high, 2=senior high/technical secondary/vocational high school, 3=college or above. b, self-rated health: 1=best to 5=worst. |
2.2 核心变量描述性分析
2.2.1 通常就医点持续由基层向医院转移
表2 2012—2022年通常就医点加权构成比例Table 2 Weighted composition of usual source of care, 2012-2022 |
| Survey wave | Hospital, % (95%CI) | Primary care, % (95%CI) | Clinic, % (95%CI) |
| 2012 | 34.06 (33.34-34.78) | 43.49 (42.74-44.25) | 22.45 (21.81-23.08) |
| 2014 | 39.24 (38.49-39.99) | 43.32 (42.57-44.08) | 17.44 (16.86-18.02) |
| 2016 | 42.33 (41.55-43.11) | 39.27 (38.49-40.04) | 18.40 (17.79-19.02) |
| 2018 | 44.28 (43.43-45.13) | 33.72 (32.91-34.53) | 22.00 (21.29-22.71) |
| 2020 | 44.29 (43.29-45.29) | 32.61 (31.67-33.55) | 23.10 (22.25-23.95) |
| 2022 | 46.81 (45.82-47.79) | 30.34 (29.43-31.25) | 22.86 (22.03-23.69) |
CI, confidence interval. |
2.2.2 基层就诊流出上升且流入下降
表3 各轮调查中与前一轮相比的基层流出与流入情况Table 3 Primary care outflow and inflow in each survey wave compared with the previous wave |
| Survey wave | Primary care outflow | Stayed in primary care | Primary care inflow | Stayed in non-primary care |
| 2014 | 3 718 (35.47) | 7 017 (64.53) | 4 304 (30.09) | 8 677 (69.91) |
| 2016 | 4 695 (40.74) | 6 520 (59.26) | 3 314 (25.56) | 9 057 (74.44) |
| 2018 | 4 245 (44.54) | 5 137 (55.46) | 3 162 (21.76) | 10 264 (78.24) |
| 2020 | 2 689 (45.22) | 3 338 (54.78) | 2 358 (21.46) | 8 157 (78.54) |
| 2022 | 2 041 (45.22) | 2 460 (54.78) | 1 944 (19.60) | 7 262 (80.40) |
Data are expressed as n(%). |
2.2.3 居民对三类机构的主观认知整体提升
表4 各类通常就医点主观认知加权指标Table 4 Weighted perceived quality indicators by provider type |
| Survey wave | Hospital | Primary care | Clinic | ||||||||
| Sat | Pmc | Composite | Sat | Pmc | Composite | Sat | Pmc | Composite | |||
| 2012 | 3.549 | 3.503 | 3.526 | 3.456 | 3.259 | 3.357 | 3.405 | 3.295 | 3.350 | ||
| 2014 | 3.559 | 3.528 | 3.543 | 3.434 | 3.254 | 3.344 | 3.379 | 3.263 | 3.320 | ||
| 2016 | 3.607 | 3.544 | 3.576 | 3.482 | 3.284 | 3.384 | 3.458 | 3.340 | 3.399 | ||
| 2018 | 3.647 | 3.606 | 3.626 | 3.583 | 3.376 | 3.480 | 3.601 | 3.443 | 3.522 | ||
| 2020 | 3.822 | 3.792 | 3.806 | 3.760 | 3.509 | 3.635 | 3.730 | 3.581 | 3.655 | ||
| 2022 | 3.839 | 3.827 | 3.832 | 3.778 | 3.532 | 3.656 | 3.810 | 3.673 | 3.742 | ||
Sat, satisfaction score; Pmc, perceived medical competence score; Composite, composite score, which is the average of satisfaction score and perceived medical competence score. Each score ranges from 1 (lowest) to 5 (highest), with higher scores indicating better evaluations. |
2.2.4 相对收入变化以稳定为主、温和流动为辅
表5 相邻两轮调查收入变化类型构成(末期权重)Table 5 Distribution of income-change types across adjacent waves (end-wave weights) |
| Interval | Weighted valid n | Downward 2 levels/% | Downward 1 level/% | No change/% | Upward 1 level/% | Upward 2 levels/% |
| 2012→2014 | 20 739 | 5.08 | 19.38 | 50.64 | 19.72 | 5.19 |
| 2014→2016 | 22 203 | 4.21 | 18.35 | 53.75 | 18.87 | 4.82 |
| 2016→2018 | 22 483 | 3.14 | 19.18 | 56.42 | 17.94 | 3.31 |
| 2018→2020 | 16 164 | 2.79 | 17.04 | 58.94 | 18.37 | 2.87 |
| 2020→2022 | 13 093 | 2.96 | 17.51 | 60.33 | 16.61 | 2.60 |
Valid n with income-group observed at both ends (unweighted) equals weighted valid n in all waves; therefore the unweighted column is omitted. Income change is defined here by relative income-group mobility across adjacent waves; “upward 1 level” indicates low to middle or middle to high, and “downward 1 level” indicates high to middle or middle to low; “upward 2 level” indicates low to high, and “downward 2 level” indicates high to low. |
2.3 主观认知、收入变化与通常就医点转移的关联:二分类Logistic回归结果
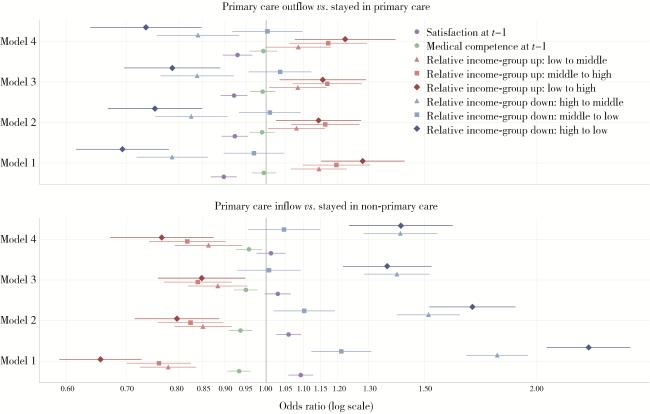


图1 两类就医点转移结局中核心解释变量的关联强度Figure 1 Core predictor effects in two transition outcomes Points indicate odd ratios(OR) and horizontal lines indicate 95% confidence intervals (CI); standard errors are clustered at the individual level. t-1 denotes the previous survey wave. Model 1 includes core predictors (satisfaction score, perceived medical competence score, and six income-change pathways based on relative income-group shifts; see Table 4 and Table 5 for detailed definitions of these terms) plus year fixed effects and baseline income group; Model 2 further adds predisposing factors (sex, age, education, marital status); Model 3 further adds enabling factors (urban residence, insurance, agricultural hukou, region); Model 4 further adds need factors (self-rated health, chronic disease, hospitalization). Medical expenditure is included only in sensitivity analyses. |
表6 二分类Logistic回归主模型(Model 4)全变量估计结果Table 6 Full variable estimates from binary Logistic Model 4 |
| Variable | Primary care inflow vs. stayed in non-primary care (n=56 750) | Primary care outflow vs. stayed in primary care (n=39 831) | |||||
| OR | 95%CI | P value | OR | 95%CI | P value | ||
| Agricultural hukou | 2.051 | 1.931-2.179 | < 0.001 | 0.655 | 0.610-0.702 | < 0.001 | |
| Perceived medical competence | 0.947 | 0.919-0.977 | < 0.001 | 0.996 | 0.965-1.028 | 0.797 | |
| Insurance coverage | 1.109 | 1.034-1.190 | 0.004 | 0.859 | 0.791-0.933 | < 0.001 | |
| Region: eastern | 1.987 | 1.859-2.125 | < 0.001 | 0.509 | 0.469-0.552 | < 0.001 | |
| Region: central | 1.888 | 1.756-2.031 | < 0.001 | 0.563 | 0.516-0.614 | < 0.001 | |
| Region: western | 1.684 | 1.569-1.807 | < 0.001 | 0.571 | 0.525-0.621 | < 0.001 | |
| Urban residence | 0.684 | 0.651-0.718 | < 0.001 | 1.121 | 1.066-1.178 | < 0.001 | |
| Female | 0.929 | 0.889-0.970 | < 0.001 | 1.065 | 1.018-1.115 | 0.006 | |
| Married/cohabiting | 1.179 | 1.111-1.250 | < 0.001 | 0.800 | 0.752-0.851 | < 0.001 | |
| Year: 2016 | 0.737 | 0.695-0.782 | < 0.001 | 1.385 | 1.308-1.467 | < 0.001 | |
| Year: 2018 | 0.590 | 0.557-0.625 | < 0.001 | 1.623 | 1.531-1.721 | < 0.001 | |
| Year: 2020 | 0.571 | 0.537-0.608 | < 0.001 | 1.611 | 1.508-1.722 | < 0.001 | |
| Year: 2022 | 0.556 | 0.520-0.595 | < 0.001 | 1.571 | 1.458-1.692 | < 0.001 | |
| Age | 1.010 | 1.008-1.012 | < 0.001 | 0.987 | 0.986-0.989 | < 0.001 | |
| Any chronic disease | 0.897 | 0.845-0.952 | < 0.001 | 1.057 | 0.991-1.128 | 0.092 | |
| Relative income-group up: middle to high | 0.840 | 0.770-0.916 | < 0.001 | 1.172 | 1.072-1.280 | < 0.001 | |
| Relative income-group up: low to middle | 0.878 | 0.814-0.948 | < 0.001 | 1.089 | 1.012-1.172 | 0.023 | |
| Relative income-group up: low to high | 0.840 | 0.752-0.939 | 0.002 | 1.166 | 1.044-1.302 | 0.007 | |
| Relative income-group down: middle to low | 1.014 | 0.935-1.100 | 0.730 | 1.035 | 0.955-1.121 | 0.402 | |
| Relative income-group down: high to middle | 1.397 | 1.286-1.519 | < 0.001 | 0.839 | 0.764-0.922 | < 0.001 | |
| Relative income-group down: high to low | 1.371 | 1.224-1.536 | < 0.001 | 0.785 | 0.694-0.888 | < 0.001 | |
| Income group: middle | 0.892 | 0.833-0.956 | 0.001 | 1.015 | 0.948-1.087 | 0.671 | |
| Income group: high | 0.636 | 0.591-0.684 | < 0.001 | 1.233 | 1.141-1.333 | < 0.001 | |
| Education levela | 0.821 | 0.800-0.844 | < 0.001 | 1.042 | 1.011-1.075 | 0.008 | |
| Satisfaction | 1.027 | 0.994-1.062 | 0.112 | 0.925 | 0.894-0.957 | < 0.001 | |
| Self-rated healthb | 0.958 | 0.940-0.976 | < 0.001 | 1.031 | 1.011-1.051 | 0.002 | |
| Hospitalization in past 12 months | 0.889 | 0.832-0.949 | < 0.001 | 1.140 | 1.057-1.229 | < 0.001 | |
All predictors were measured at the baseline (the previous survey wave, denoted as t-1 in the Methods), except for the “Relative income-group” variables, which represent change from baseline to the current survey wave (t-1 to t). a, education level: 0=primary school or below, 1=junior high, 2=senior high/technical secondary/vocational high school, 3=college or above. b, self-rated health: 1=best to 5=worst. |