Joint trajectories and evolution patterns of direct and indirect maternal mortality across 204 countries from 2000 to 2021

  • Yi ZHOU ,
  • Zhao CHENG ,
  • Xinglin FENG , *
Expand
  • Department of Health Policy and Management, Peking University School of Public Health, Beijing 100191, China
FENG Xinglin, e-mail,

Received date: 2026-02-24

  Online published: 2026-04-09

Copyright

All rights reserved. Unauthorized reproduction is prohibited.

Abstract

Objective: To identify joint trajectory patterns of direct and indirect maternal mortality ratios (MMR) at the country level from 2000 to 2021, and to compare phase-specific changes during the millennium development goals (MDG, 2000 to 2015) and the sustainable development goals (SDG, 2015 to 2021) periods, as well as differences in health system and policy environments across trajectory groups. Methods: Data on maternal mortality among women aged 15-49 years in 204 countries and territories from 2000 to 2021 were obtained from the Global Burden of Disease (GBD) Study. Direct cause MMR and indirect cause MMR at five time points (2000, 2005, 2010, 2015, and 2021) were jointly analyzed using longitudinal K-means clustering (k=2-6). The optimal number of clusters was determined by the Calinski-Harabasz (CH) index. Based on the clustering results, a piecewise linear mixed effects model with random intercepts was fitted with a knot in 2015 to estimate the baseline intercept in 2000 and period-specific slopes for the MDG and SDG phases. For 2021, health system and policy-related indicators, including antenatal care coverage (≥4 visits, ANC4), proportion of women with a demand for contraception that are using a modern method, cesarean section rate, female human immunodeficiency virus (HIV) prevalence, in facility delivery rate, skilled birth attendance, and an abortion legality index were compared across clusters using the Kruskal-Wallis H test. All tests were two-sided, and P < 0.05 was considered statistically significant. Results: The CH index peaked at k=3 (CH=342.63), classifying the 204 countries and territories into three joint trajectory clusters: high burden (n= 66), medium burden (n=88), and low burden (n=50). In 2021, direct MMR was 334.6 (95%CI: 282.5- 386.7), 65.6 (95%CI: 50.4-80.7), and 5.4 (95%CI: 3.7-7.0) per 100 000 live births in the high, medium, and low burden clusters, respectively; indirect MMR was 33.6 (95%CI: 27.9-39.2), 18.2 (95%CI: 13.5-22.9), and 0.9 (95%CI: 0.6-1.3) per 100 000 live births, respectively. The piecewise mixed effects model showed significant declines in direct MMR during the MDG period in all clusters (slopes: -0.020, -0.016, and -0.036; P < 0.001), whereas declines slowed and became non-significant during the SDG period (-0.011, 0.011, and -0.006; P > 0.05). For indirect MMR, modest increases were observed during the MDG period in the high and medium burden clusters (0.029 and 0.015; P < 0.05), with no significant change in the low burden cluster (P > 0.05). During the SDG period, indirect MMR increased markedly in the medium burden cluster (slope: 0.121; 95%CI: 0.092-0.151; P < 0.001), while remaining broadly stable in the high and low burden clusters (P > 0.05). Health system and policy indicators differed significantly across the clusters (P < 0.001): the high burden cluster showed lower ANC4 coverage, lower in facility delivery and skilled birth attendance, lower demand for contraception satisfied by modern methods, and higher female HIV prevalence; the medium burden cluster achieved near universal in facility delivery and skilled birth attendance but had a higher cesarean section rate; the low-burden cluster generally showed more favorable indicator profiles and a higher abortion legality index. Conclusion: Distinct joint trajectories of direct and indirect maternal mortality were observed globally from 2000 to 2021. While reductions in direct maternal mortality were substantial during the MDG era, progress broadly slowed and plateaued during the SDG era. Meanwhile, the pronounced rise in indirect maternal mortality in medium-burden countries during the SDG period suggests potential structural risk accumulation even when overall MMR appears stable. Incorporating joint direct-indirect trajectories into routine monitoring may facilitate stage and cluster specific prioritization of maternal health interventions.

Cite this article

Yi ZHOU , Zhao CHENG , Xinglin FENG . Joint trajectories and evolution patterns of direct and indirect maternal mortality across 204 countries from 2000 to 2021[J]. Journal of Peking University(Health Sciences), 2026 , 58(3) : 496 -502 . DOI: 10.19723/j.issn.1671-167X.2026.03.008

孕产妇死亡率(maternal mortality ratio,MMR)是衡量国家或地区卫生系统效能与女性健康权益的核心公共卫生指标。联合国孕产妇死亡估计机构(UN Maternal Mortality Estimation Inter-agency Group, MMEIG)小组报告显示,全球MMR从2000年的339/10万活产降至2020年的223/10万活产[1-3],而2015年至2020年间下降幅度明显有限[约(223~227)/10万活产],与此同时,孕产妇死亡死因构成正在发生流行病学转变:世界卫生组织系统分析(2009—2020年)显示,全球孕产妇死亡首位死因为出血(约27%),其次为间接产科死因(约23%),以及高血压疾病(约16%),且不同地区间比例差异显著[4-5]。在此背景下,仅依赖总体MMR水平或总体趋势分析,可能难以充分描述孕产妇死亡负担的结构性变化及其背后的系统性约束。
既往纵向研究多以总体MMR为单一结局,侧重描述总体趋势或区域差异,而对直接与间接死因在时间维度上的协同演变及其跨千年发展目标期间(millennium development goals,MDG)与可持续发展目标(sustainable development goals,SDG)阶段差异关注有限[6-8]。基于全球疾病负担(Global Burden of Disease,GBD)数据,本研究将直接与间接MMR作为联合结局,通过纵向聚类识别2000—2021年国家层面的潜在联合轨迹类型,并以2015年为分段结点,采用分段混合效应模型比较MDG(2000—2015年)与SDG(2015—2021年)阶段变化,同时分析不同轨迹类型国家卫生系统与制度环境指标差异,为分阶段、分类型确定干预重点提供依据。

1 资料与方法

1.1 数据来源

本研究基于GBD研究数据库,该数据库包括204个国家和地区的375种疾病和伤害的发病率、患病率、死亡率、伤残寿命损失年(years lived with disability, YLD)、因早死所致的寿命损失年(years of life lost, YLL)和伤残调整寿命年(disability adjusted life years, DALY)等指标[9-10]。本研究以2000—2021年为观察期,纳入全球204个国家和地区15~49岁育龄妇女的孕产妇死亡指标。鉴于孕产妇死亡变化通常呈现长期、非线性特征,且年度波动可能受估计不确定性影响,本研究选取2000、2005、2010、2015和2021年作为关键时间节点,构建国家层面的纵向面板数据,以平衡时间分辨率与趋势稳定性。

1.2 分析指标

本研究主要结局指标为国家层面孕产妇死亡率(单位:每10万活产),并按GBD研究数据库死因框架分为直接产科死因MMR与间接产科死因MMR作为联合分析结局。直接产科死因MMR定义为GBD研究数据库中以下七类直接原因死亡率之和:(1)产科出血;(2)妊娠期高血压疾病;(3)产科败血症及其他孕产妇感染;(4)梗阻性难产及子宫破裂;(5)流产(包括人工流产与自然流产);(6)异位妊娠;(7)其他直接产科疾病。间接产科死因MMR采用GBD研究数据库间接产科死因分类指标。
为比较不同轨迹类型国家的卫生系统与制度环境差异,本研究提取2021年以下指标用于组间描述与比较:至少4次产前检查覆盖率[antenatal care coverage(≥4 times),ANC4]、满足现代化避孕的比例、剖宫产率、女性人类免疫缺陷病毒(human immunodeficiency virus,HIV)流行率、机构分娩率、专业接生人员覆盖率(skilled birth attendance)以及流产合法性指数。相关数据来源于GBD协变量数据库[11]

1.3 统计学分析

采用Stata18.0软件完成统计分析,制图使用Python3.9软件。为识别不同国家在直接与间接孕产妇死亡结构及其时间演变模式上的异质性,本研究采用联合轨迹分析策略。首先,基于纵向K-means聚类算法,将各国家在5个时间节点上的直接与间接MMR取对数后构建为多维时间序列,计算国家间在联合轨迹空间中的euclidean距离,并将演变模式相似的国家划分为同一潜在轨迹类别。聚类数量k的搜索范围设定为2~6类,选取Calinski-Harabasz(CH)指数最大的分型方案作为最终结果。在聚类分型的基础上,为定量刻画不同轨迹类型国家在关键政策阶段的孕产妇死亡变化特征,本研究进一步构建分段线性混合效应模型,分别对直接与间接孕产妇死亡率的纵向变化进行拟合。模型以2015年(即千年发展目标与可持续发展目标的交汇点)作为时间节点,引入随机截距效应以控制国家内部的重复测量自相关,量化各轨迹类型国家在2000年的初始死亡水平、2000—2015年的变化斜率以及2015—2021年的变化斜率。不同轨迹不同类型国家宏观卫生系统指标以M(P25, P75)表示,类型间比较采用Kruskal-Wallis H检验。双侧检验,P<0.05认为差异具有统计学意义。混合效应模型参数采用限制性极大似然法估计,结果以回归系数及其95%置信区间(confidence interval,CI)表示。

2 结果

2.1 全球孕产妇死亡联合轨迹的聚类分型与地理分布

在纵向聚类分析中,对预设聚类数k=2~6的模型进行拟合比较,发现当k=3时CH指数达到峰值(CH=342.63),高于k=2(CH=307.84)及k=4~6(CH=236.67~285.05)。综合指标表现与公共卫生可解释性最终确定最优聚类数为3,将全球204个国家和地区在2000—2021年直接与间接孕产妇死亡率的联合纵向演变轨迹划分为高负担组(Cluster 1,n=66)、中等负担组(Cluster 2,n=88)和低负担组(Cluster 3,n=50)3类,3类分组在直接孕产妇死亡率和间接孕产妇死亡率上均表现出从高到低的梯度特征(表 1)。
表1 2021年不同联合轨迹类型国家分死因孕产妇死亡率(每10万活产)

Table 1 Cause-specific maternal mortality ratios by joint trajectory cluster in 2021 (per 100 000 live births)

Cause-specific category High burden (Cluster 1) Medium burden (Cluster 2) Low burden (Cluster 3)
Direct maternal deaths 334.6 (282.5, 386.7) 65.6 (50.4, 80.7) 5.4 (3.7, 7.0)
Ectopic pregnancy 23.9 (18.9, 29.0) 3.0 (2.0, 3.9) 0.2 (0.1, 0.2)
Maternal abortion and miscarriage 41.1 (32.5, 49.7) 4.2 (3.3, 5.1) 0.2 (0.1, 0.3)
Maternal obstructed labor and uterine rupture 17.7 (14.1, 21.4) 4.0 (2.2, 5.7) 0.2 (0.1, 0.3)
Maternal hemorrhage 74.3 (59.7, 88.8) 9.4 (6.4, 12.3) 0.8 (0.5, 1.0)
Maternal hypertensive disorders 71.4 (59.0, 83.9) 14.8 (11.5, 18.1) 1.0 (0.7, 1.2)
Maternal sepsis and other maternal infections 44.9 (31.9, 57.9) 4.3 (3.0, 5.5) 0.2 (0.1, 0.2)
Other direct maternal disorders 61.3 (50.5, 72.0) 26.0 (17.3, 34.7) 2.9 (1.5, 4.2)
Indirect maternal deaths 33.6 (27.9, 39.2) 18.2(13.5, 22.9) 0.9 (0.6, 1.3)

Values are matermal mortality ratios (MMR) per 100 000 live births, shown as estimate (95%CI).

高负担组主要集中于撒哈拉以南非洲及部分南亚国家,2021年直接MMR为334.6/10万活产(95%CI:282.5~386.7),显著高于其余两组;其中死亡率较高的直接死因包括产科出血(74.3/10万活产)、妊娠期高血压疾病(71.4/10万活产)、其他直接产科疾病(61.3/10万活产)以及产科败血症和其他孕产妇感染(44.9/10万活产)。该组间接MMR为33.6/10万活产(95%CI:27.9~39.2)。中等负担组广泛分布于拉丁美洲、东南亚及部分中东和北非国家,2021年直接MMR为65.6/10万活产(95%CI:50.4~80.7),其直接死因以妊娠期高血压疾病(14.8/10万活产)和产科出血(9.4/10万活产)为主,其他直接产科疾病为26.0/10万活产;间接MMR为18.2/10万活产(95%CI:13.5~22.9)。低负担组主要分布于欧洲与北美地区,2021年直接MMR为5.4/10万活产(95%CI:3.7~7.0),间接MMR为0.9/10万活产(95%CI:0.6~1.3);各类直接与间接死因死亡率均处于低水平,单一死因均未超过3.0/10万活产(表 1)。

2.2 不同轨迹类型国家孕产妇死亡率的长期演变特征

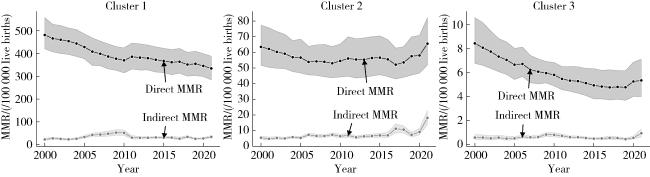
2000—2021年,三组国家在直接与间接死因的长期变化趋势及分段特征上存在明显异质性(图 1)。在直接死因方面,MDG时期三组国家的直接孕产妇死亡率均呈显著下降趋势,高负担组(Cluster 1)、中等负担组(Cluster 2)和低负担组(Cluster 3)年均分别下降约1.98%、1.59%和3.54%(对应斜率分别为-0.020、-0.016和-0.036,P<0.001,表 2);而在SDG时期,直接死因下降趋势普遍减弱并趋于停滞,高负担组年均下降1.09%(斜率=-0.011,95%CI:-0.022~0.001),中等负担组年均上升1.11%(斜率=0.011,95%CI:-0.008~0.030),低负担组年均下降0.60%(斜率=-0.006,95%CI:-0.023~0.012),上述变化均未达到统计学显著性。
图1 2000—2021年不同联合轨迹类型国家直接与间接孕产妇死亡率的平均变化轨迹

Figure 1 Mean trajectories of direct and indirect maternal mortality ratios by joint trajectory cluster from 2000 to 2021

Black solid lines represent direct maternal mortality ratios, and gray dashed lines represent indirect maternal mortality ratios. Shaded areas indicate 95% confidence intervals. MMR, matermal mortality ratios.

表2 基于分段混合效应模型的孕产妇死亡率截距与不同时期变化斜率估计值

Table 2 Estimated intercepts (baseline 2000) and period-specific slopes from the piecewise linear mixed-effects model

Trajectory cluster Intercept (2000 baseline) MDG slope (2000-2015) SDG slope (2015-2021)
Direct
  Cluster 1 5.979 (5.824, 6.135)*** -0.020 (-0.025, -0.016)*** -0.011 (-0.022, 0.001)
  Cluster 2 3.842 (3.666, 4.018)*** -0.016 (-0.024, -0.008)*** 0.011 (-0.008, 0.030)
  Cluster 3 1.934 (1.769, 2.100)*** -0.036 (-0.043, -0.029)*** -0.006 (-0.023, 0.012)
Indirect
  Cluster 1 2.958 (2.781, 3.135)*** 0.029 (0.014, 0.044)*** -0.011 (-0.048, 0.026)
  Cluster 2 1.346 (1.164, 1.528)*** 0.015 (0.003, 0.028)* 0.121 (0.092, 0.151)***
  Cluster 3 -1.009 (-1.293, -0.726)*** 0.009 (-0.008, 0.026) 0.006 (-0.035, 0.047)

The mixed-effects model used the natural logarithm of the maternal mortality ratio (ln MMR) as the dependent variable; slopes represent the annual change on the log scale. MDG, millenmium development goals; SDG, sustainable development goals; MMR, maternal mortality ratio. *P<0.05, ***P<0.001.

在间接死因方面,各组呈现更为显著的跨期分化。MDG时期,高负担组与中等负担组间接死因呈小幅上升(斜率分别为0.029和0.015,P<0.05)。SDG时期,高负担组间接死因总体平稳(斜率-0.011,P>0.05);而中等负担组间接死因出现显著加速上升,变化斜率为0.121(95%CI:0.092~0.151,P<0.001)。低负担组间接死因在整个观察期内两阶段变化均不显著(P>0.05)。

2.3 不同轨迹类型国家的卫生系统及社会学特征差异

不同孕产妇死亡联合轨迹类型国家在核心卫生服务覆盖、妇女健康风险暴露及生育制度环境指标上差异均有统计学意义(Kruskal-Wallis H检验,P<0.001;表 3)。高负担组国家在2021年的基础产科服务可及性方面整体处于最低水平。其至少4次产前检查(ANC4)覆盖率中位数为63.25%(50.05%, 81.66%),明显低于中等(93.60%)和低负担组国家(99.18%)。该组机构内分娩率中位数为85.95%(64.28%, 92.79%),专业助产人员覆盖率为87.13%(70.59%, 94.23%),均低于其余两组。与此同时,避孕需求满足率中位数为52.73%(39.85%, 73.38%),女性HIV流行率中位数为1.22%,高于其他两组。中等负担组国家在2021年基础产科服务供给方面已达到较高水平,其机构分娩率(99.35%)和专业助产覆盖率(99.56%)与低负担组基本相当。此外,其避孕需求满足率(74.94%)和女性HIV流行率(0.13%)均介于低负担组与高负担组之间。低负担组国家在多数指标上处于较优水平:ANC4覆盖率中位数为99.18%(97.93%, 99.67%),机构内分娩率与专业接生人员覆盖率均接近全覆盖,分别为99.82%(99.61%, 99.91%)和99.80%(99.49%, 99.90%)。其现代避孕方法需求满足率中位数为89.78%(71.21%, 92.98%),女性HIV流行率最低为0.04%(0.01%, 0.12%)。在制度环境方面,低负担组堕胎合法性指数中位数为85.00(70.00, 90.00),高于高负担组的50.72(40.00, 65.00)与中等负担组的60.00(40.00, 90.00)。
表3 2021年不同轨迹类型国家孕产妇卫生资源比较

Table 3 Comparison of health resources among countries with different maternal mortality trajectories in 2021

Variable High burden (Cluster 1) Medium burden (Cluster 2) Low burden (Cluster 3) Kruskal-Wallis H
ANC(≥4 visits)/% 63.25 (50.05, 81.66) 93.60 (86.34, 96.34) 99.18 (97.93, 99.67) 126.69***
Demand for contraception using a modern method/% 52.73 (39.85, 73.38) 74.94 (57.49, 84.60) 89.78 (71.21, 92.98) 54.25***
Cesarean section rate/% 10.66 (6.02, 20.72) 32.03 (21.05, 42.43) 30.72 (22.00, 36.40) 63.36***
HIV prevalence in women/% 1.22 (0.16, 3.60) 0.13 (0.05, 0.29) 0.04 (0.01, 0.12) 59.44***
In-facility delivery rate/% 85.95 (64.28, 92.79) 99.35 (96.99, 99.76) 99.82 (99.61, 99.91) 105.19***
Skilled birth attendance/% 87.13 (70.59, 94.23) 99.56 (98.65, 99.83) 99.80 (99.49, 99.90) 102.54***
Abortion legality index 50.72 (40.00, 65.00) 60.00 (40.00, 90.00) 85.00 (70.00, 90.00) 35.50***

Data are M (P25, P75). Group differences were assessed using the Kruskal-Wallis rank-sum test, with H statistics reported; ANC, antenatal care coverage; HIV, human immunodeficiency virus. *** P<0.001.

3 讨论

本研究基于CBD研究数据库2000—2021年国家层面数据,将直接与间接孕产妇死亡率作为联合结局变量,识别出高负担、中等负担和低负担3类联合轨迹。结果显示,不同轨迹类型国家不仅在2021年孕产妇死亡水平上存在明显梯度差异,而且在MDG向SDG过渡过程中,直接与间接死因的演变方向也呈现差异,提示全球孕产妇死亡率变化并非单一线性下降过程,而是表现为伴随负担水平分层的结构性分化。
高负担国家呈现出MDG阶段直接死因显著下降、SDG阶段下降放缓并趋于停滞的特征。至2021年仍维持在334.6/10万活产的高位。说明在基础产科服务扩展取得一定进展后,进一步降低死亡负担仍受制于服务可及性、转诊衔接和照护质量等系统能力约束。在此背景下,单纯依赖服务数量扩张所带来的边际收益可能逐步下降,从而制约了直接产科死因的进一步快速下降[12-14]。上述发现与既往关于全球高负担地区孕产妇死亡改善放缓的研究结论一致[1],提示高负担国家下一阶段的重点仍应放在基础产科服务可及性提升与质量改进上。
中等负担组国家呈现出与高负担组国家不同的死亡结构与演变模式:2015—2021年间接孕产妇死亡率显著上升,而同期直接死因未出现相应回升,形成直接死因相对稳定、间接死因持续增加的分化模式。与此同时中等负担组国家在基础产科服务覆盖方面已接近低负担组国家水平:结合其机构分娩率和专业助产覆盖率已接近全覆盖,提示该阶段孕产妇死亡风险的决定因素,可能正在由服务接触不足转向慢性病、内科合并症、高危妊娠识别及多学科协同管理不足。在产科转型框架下[4, 15-17],这一阶段死亡风险对照护质量、急危重症识别与及时转诊,以及多学科协同管理能力的敏感性,通常高于对服务数量扩张的依赖[18]。由此可见,中等负担阶段并非孕产妇死亡率自然下降过程中的简单过渡,而是防控策略由覆盖扩展转向质量导向与结构优化的关键窗口。在维持高覆盖的同时,应更聚焦于高危孕产妇筛查、合并症管理、围产期急救与转诊网络,以及围分娩期质量改进,以遏制间接死因的持续攀升趋势[13, 19]
本研究提示仅依据总体孕产妇死亡率进行监测,可能不足以及时识别死亡结构的内部变化,尤其在直接死因得到一定控制后,总体MMR相对稳定并不意味着风险未发生转移;相反,间接死因可能已成为新的增长来源。已有研究基于全球151个国家的多阶段死亡过渡模型证实,在产科干预覆盖率不断提高的背景下,孕产妇死因构成会不可避免地从急性产科并发症向间接内科合并症发生结构性转移[20]。因此,单纯依赖总体孕产妇死亡率作为政策绩效评估依据,可能不足以支持对孕产妇健康风险的前瞻性干预。相较而言,将直接与间接死因的构成变化纳入常规监测框架,有助于更早识别不同发展阶段国家所面临的关键风险类型,并为干预策略由覆盖扩展向功能整合与质量导向调整提供更加敏感的决策依据。另外,不同区域存在的卫生资源覆盖差异依然提示着加强卫生人力资源覆盖的必要性[21],例如,针对性地推广助产士主导的干预体系并实现全民覆盖,被证实可在15年内将孕产妇死亡率显著降低67%[22],这不仅是规模的扩大,更是对死亡过渡关键期人力支撑的精准响应。
本研究亦存在一定局限性。首先,GBD研究数据库数据在部分低收入和数据匮乏国家仍主要依赖模型估计,其结果可能受到基础数据影响[23];其次,本研究基于国家层面的分析框架,难以反映国家内部地区差异及人群异质性,需要说明的是,尽管3类分组在均值层面均呈一致梯度分布,但在国家层面仍有少数国家存在直接与间接负担不完全同步的情况,不过此类异质性数量有限,未改变整体的高-中-低负担分组格局;再次,在死因划分方面,本研究主要聚焦于直接与间接孕产妇死亡两大类别,未进一步细分具体疾病病因,且采用关键时间节点进行联合轨迹建模,可能无法充分反映短期波动。未来可结合更细分的死因数据、连续时间序列及次国家尺度(地区层面)资料,进一步阐明不同轨迹类型国家孕产妇死亡结构演变的具体机制,以更全面地揭示不同轨迹类型国家孕产妇死亡结构演变的具体机制。
综上所述,2000—2021年全球孕产妇死亡在直接与间接死因层面呈现出显著分化的联合演变轨迹。尤其中等负担国家在SDG阶段间接孕产妇死亡率年均超过10% 的快速上升,表明在总体孕产妇死亡率水平相对稳定的背景下,死亡结构已发生实质性转变。该结果提示,全球孕产妇死亡防控亟需由以降低总量为核心,转向更加关注死亡结构与卫生系统功能匹配的干预模式,即高负担国家仍应优先强化基础产科服务可及性与质量,中等负担国家则需在高覆盖背景下重点提升对慢性病与内科合并症的连续管理及高危妊娠的综合救治能力,避免单纯依赖服务数量扩张所带来的边际效益递减。本研究通过联合轨迹分析揭示了不同国家孕产妇死亡演变路径的系统性差异,为制定分阶段、分类型的孕产妇健康干预策略提供了定量依据。

利益冲突  所有作者均声明不存在利益冲突。

作者贡献声明  周一:研究设计,数据分析,论文撰写;程钊:数据分析;冯星淋:研究设计,总体把关和审定论文。所有作者均参与论文修改,并对最终文稿进行审读和确认。

1
World Health Organization, UNICEF, UNFPA, et al. Trends in maternal mortality 2000 to 2020: Estimates by WHO, UNICEF, UNFPA, World Bank Group and UNDESA/Population Division[M/OL]. Geneva: World Health Organization, 2023[2026-02-01]. https://iris.who.int/server/api/core/bitstreams/c3957b94-cdd5-47d7-85f8-6202be229f8e/content.

2
World Health Organization. SDG target 3.1 maternal mortality[EB/OL]. [2026-02-01]. https://www.who.int/data/gho/data/themes/topics/sdg-target-3-1-maternal-mortality.

3
World Health Organization. Millennium development goals (MDG)[EB/OL]. [2026-02-01]. https://www.who.int/zh/news-room/fact-sheets/detail/millennium-development-goals-%28mdgs%29.

4
Souza JP , Tunçalp , Vogel JP , et al. Obstetric transition: The pathway towards ending preventable maternal deaths[J]. BJOG, 2014, 121 (Suppl 1): 1- 4.

5
Souza JP , Day LT , Rezende-Gomes AC , et al. A global analysis of the determinants of maternal health and transitions in maternal mortality[J]. Lancet Glob Health, 2024, 12 (2): e306- e316.

DOI

6
Cresswell JA , Alexander M , Chong MYC , et al. Global and regional causes of maternal deaths 2009-20: A WHO systematic analysis[J]. Lancet Glob Health, 2025, 13 (4): e626- e634.

DOI

7
Feng J , Huang J , Wu Q , et al. Maternal mortality ratios in Southeast Asia (1990-2021): Trends, disparities, and projections through 2050 based on the global burden of disease 2021, with reference to SDG 3.1[J]. BMC Pregnancy Childbirth, 2025, 25 (1): 1264.

DOI

8
Sepanlou SG , Rezaei Aliabadi H , Malekzadeh R , et al. Levels and trends of maternal mortality and morbidity by cause in north Africa and middle east, 1990 to 2019: An analysis for the global burden of disease study 2019[J]. Arch Iran Med, 2022, 25 (10): 666- 675.

DOI

9
GBD 2023 Causes of Death Collaborators . Global burden of 292 causes of death in 204 countries and territories and 660 subnational locations, 1990-2023: A systematic analysis for the Global Burden of Disease Study 2023[J]. Lancet, 2025, 406 (10513): 1811- 1872.

10
Hay SI , Ong KL , Santomauro DF , et al. Burden of 375 diseases and injuries, risk-attributable burden of 88 risk factors, and healthy life expectancy in 204 countries and territories, including 660 subnational locations, 1990-2023: A systematic analysis for the Global Burden of Disease Study 2023[J]. Lancet, 2025, 406 (10513): 1873- 1922.

11
Global Burden of Disease Collaborative Network. Global Burden of Disease Study 2023 (GBD 2023) Covariates 1980-2023[EB/OL]. [2026-02-15]. https://doi.org/10.6069/b09t-1r53.

12
Kruk ME , Gage AD , Joseph NT , et al. Mortality due to low-quality health systems in the universal health coverage era: A systematic analysis of amenable deaths in 137 countries[J]. Lancet, 2018, 392 (10160): 2203- 2212.

DOI

13
Marthias T , Anindya K , Saputri NS , et al. Effective coverage for reproductive, maternal, neonatal and newborn health: An analysis of geographical and socioeconomic inequalities in 39 low- and middle-income countries[J]. BMJ Glob Health, 2025, 10 (2): e016549.

DOI

14
Priebe J , Amuasi J , Dartanto T , et al. Factors associated with skilled birth attendance in 37 low-income and middle-income countries: A secondary analysis of nationally representative, individual-level data[J]. Lancet Glob Health, 2024, 12 (7): e1104- e1110.

DOI

15
Say L , Chou D , Gemmill A , et al. Global causes of maternal death: A WHO systematic analysis[J]. Lancet Glob Health, 2014, 2 (6): e323- e333.

16
Chaves SC , Cecatti JG , Carroli G , et al. Obstetric transition in the World Health Organization multicountry survey on maternal and newborn health: Exploring pathways for maternal mortality reduction[J]. Rev Panam Salud Publica, 2015, 37 (4/5): 203- 210.

17
Cirelli JF , Surita FG , Costa ML , et al. The burden of indirect causes of maternal morbidity and mortality in the process of obstetric transition: A cross-sectional multicenter study[J]. Rev Bras Ginecol Obstet, 2018, 40 (3): 106- 114.

18
Banke-Thomas A , Wong KLM , Olubodun T , et al. Geographical accessibility to functional emergency obstetric care facilities in urban Nigeria using closer-to-reality travel time estimates: A population-based spatial analysis[J]. Lancet Glob Health, 2024, 12 (5): e848- e858.

19
Ferede Gebremedhin A , Dawson A , Hayen A . Evaluations of effective coverage of maternal and child health services: A systematic review[J]. Health Policy Plan, 2022, 37 (7): 895- 914.

20
Boerma T , Campbell OMR , Amouzou A , et al. Maternal mortality, stillbirths, and neonatal mortality: A transition model based on analyses of 151 countries[J]. Lancet Glob Health, 2023, 11 (7): e1024- e1031.

21
Langlois EV , Reid A , Khosla R . Mothers deserve better: Evidence-based strategies to address maternal mortality[J]. Lancet Glob Health, 2025, 13 (5): e797- e798.

22
Nove A , Friberg IK , de Bernis L , et al. Potential impact of midwives in preventing and reducing maternal and neonatal mortality and stillbirths: A lives saved tool modelling study[J]. Lancet Glob Health, 2021, 9 (1): e24- e32.

23
GBD 2019 Risk Factors Collaborators . Global burden of 87 risk factors in 204 countries and territories, 1990-2019: A systematic analysis for the Global Burden of Disease Study 2019[J]. Lancet, 2020, 396 (10258): 1223- 1249.

Outlines

/