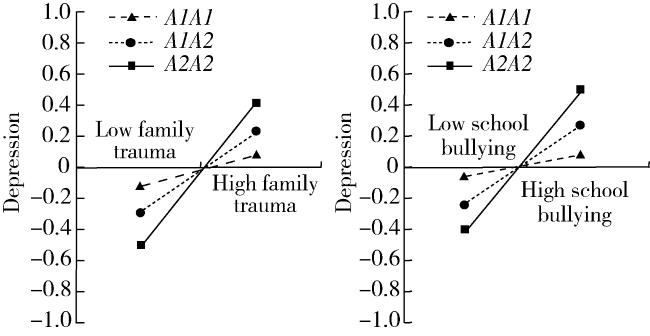
1 资料与方法
1.1 研究对象
1.2 研究方法
1.2.1 一般资料收集
1.2.2 DRD2基因多态性检测
表1 DRD2基因多态性检测引物序列Table 1 Primer sequences for DRD2 gene polymorphism detection |
| Site | Primer type | Primer sequence(5′ to 3′) | Primer length/bp |
| rs1800497 | PCR upstream primer | GCTTAGAACCACCCAGAGTG | 21 |
| PCR downstream primer | TGTCCACGCCCGCAA | 16 | |
| Single-base extension primer | CAGCACTTTGAGGATGGCTGGGCTGGAC | 28 | |
| rs2283265 | PCR upstream primer | ACGTGGTGCTGGTGCTGAT | 19 |
| PCR downstream primer | GCCGCTGGTGTTGGTGTA | 18 | |
| Single-base extension primer | GCTGGTGTTGGTGTAGCCGCTGGTG | 27 |
1.2.3 分组标准
1.3 统计学分析
2 结果
2.1 两组一般资料比较
表2 非自杀组与自杀倾向组一般资料比较Table 2 Comparison of general data between the non-suicide group and the suicide group |
| Items | Non-suicide group (n=62) | Suicide group (n=36) | χ2/t | P |
| Gender | 0.170 | 0.680 | ||
| Male | 37 (59.68) | 23 (63.89) | ||
| Female | 25 (40.32) | 13 (36.11) | ||
| Age/years | 15.34±2.62 | 15.03±2.48 | 0.576 | 0.566 |
| Disease duration/years | 3.16±0.43 | 3.51±0.67 | 3.150 | 0.002 |
| Years of education | 12.32±1.51 | 11.84±1.25 | 1.612 | 0.110 |
| Living area | 0.283 | 0.595 | ||
| Urban | 38 (61.29) | 24 (66.67) | ||
| Rural | 24 (38.71) | 12 (33.33) | ||
| Father’s education level | 0.151 | 0.697 | ||
| High school and above | 42 (67.74) | 23 (63.89) | ||
| Junior high school and below | 20 (32.26) | 13 (36.11) | ||
| Mother’s education level | 0.214 | 0.644 | ||
| High school and above | 34 (54.84) | 18 (50.00) | ||
| Junior high school and below | 28 (45.16) | 18 (50.00) | ||
| Family structure | 0.170 | 0.680 | ||
| Nuclear family | 25 (40.32) | 13 (36.11) | ||
| Non-nuclear family | 37 (59.68) | 23 (63.89) | ||
| The only child | 0.088 | 0.767 | ||
| Yes | 26 (41.94) | 14 (38.89) | ||
| No | 36 (58.06) | 22 (61.11) | ||
| Experience of staying behind | 0.074 | 0.785 | ||
| Yes | 14 (22.58) | 9 (25.00) | ||
| No | 48 (77.42) | 27 (75.00) | ||
| Conditions of boarding | 0.033 | 0.856 | ||
| Yes | 35 (56.45) | 21 (58.33) | ||
| No | 27 (43.55) | 15 (41.67) | ||
| Non-suicidal self-injury | 35.61±4.08 | 44.94±5.32 | 9.741 | <0.001 |
| Meaning of life | 45.61±5.84 | 34.12±5.12 | 9.812 | <0.001 |
| Family trauma | 49.34±5.21 | 64.16±7.21 | 11.755 | <0.001 |
| School bullying/points | 8.69±1.76 | 13.26±2.28 | 11.096 | <0.001 |
| Anxiety/score | 56.16±6.31 | 68.91±7.02 | 9.251 | <0.001 |
| Depression/score | 58.32±5.87 | 72.64±6.65 | 11.084 | <0.001 |
Data are n(%) or $\bar x \pm s$. |
2.2 DRD2基因多态性检测结果及遗传平衡检验
表3 Hardy-Weinberg遗传平衡检验Table 3 Hardy-Weinberg genetic equilibrium test |
| SNP locus | Genotype | Non-suicide group (n=62) | Suicide group (n=36) | |||||||
| Actual value | Theoretical value | χ2 | P | Actual value | Theoretical value | χ2 | P | |||
| TaqⅠA | A1A1 | 29 | 28.615 | 0.006 | 0.997 | 6 | 6.215 | 0.007 | 0.996 | |
| A1A2 | 23 | 23.154 | 8 | 7.761 | ||||||
| A2A2 | 10 | 10.231 | 22 | 22.024 | ||||||
SNP, single nucleotide polymorphism. |
2.3 两组DRD2基因遗传模式分析
表4 两组DRD2基因(TaqⅠA)遗传模式分析Table 4 Analysis of genetic patterns of DRD2 gene (TaqⅠA) in two groups |
| DRD2 gene (TaqⅠA) | Non-suicide group (n=62) | Suicide group (n=36) | OR (95%CI) | P |
| A1A1 | 29(46.77) | 6(16.67) | ||
| A1A2 | 23(37.10) | 8(22.22) | 1.125(0.846-1.432) | 0.154 |
| A2A2 | 10(16.13) | 22(61.11) | 1.874(1.496-2.328) | <0.001 |
| Explicit mode A1A1 vs. (A1A2+A2A2) | 29(46.77)/33(53.23) | 6(16.67)/30(83.33) | 1.231(0.892-1.476) | 0.106 |
| Implicit mode(A1A1+A1A2) vs. A2A2 | 52(83.87)/10(16.13) | 14(38.89)/22(61.11) | 1.695(1.326-2.021) | <0.001 |
| Additive mode A1A1 vs. A1A2 vs. A2A2 | 29(46.77)/23(37.10)/10(16.13) | 6(16.67)/8(22.22)/22(61.11) | 0.008 |
Data are n(%). |
2.4 多因素Logistic回归分析青少年自杀行为的独立影响因素
表5 多因素Logistic回归分析Table 5 Multivariate Logistic regression analysis |
| Variables | β | SE | Wald χ2 | OR(95%CI) | P |
| Course of disease | 0.210 | 0.216 | 0.948 | 1.234 (0.911-1.485) | 0.062 |
| Non-suicidal self-injury | 0.623 | 0.284 | 4.808 | 1.864 (1.549-2.297) | 0.012 |
| Meaning of life | -0.481 | 0.305 | 2.490 | 0.618 (0.405-0.859) | 0.018 |
| Family trauma | 0.853 | 0.264 | 10.433 | 2.346 (2.031-2.695) | 0.006 |
| School bullying | 0.709 | 0.281 | 6.358 | 2.031 (1.745-2.397) | 0.010 |
| Anxiety | 0.193 | 0.225 | 0.737 | 1.213 (0.846-1.594) | 0.058 |
| Depression | 0.948 | 0.269 | 12.424 | 2.581 (2.169-2.882) | 0.005 |
| A2A2 genotype of DRD2 gene (TaqⅠA) | 0.772 | 0.247 | 9.768 | 2.164 (1.793-2.455) | 0.009 |
2.5 家庭创伤和校园霸凌对青少年自杀行为的交互作用
表6 家庭创伤和校园霸凌对青少年自杀行为的交互作用Table 6 The interaction effect of family trauma and school bullying on teenagers ' suicidal behavior |
| Factors 1 | Factors 2 | Suicidal behavior | OR (95%CI) | OR (95%CI)a |
| Family trauma | School bullying | No/Yes | ||
| ≤54.78 | ≤10.37 | 27/2 | 1.000 | 1.000 |
| ≤54.78 | >10.37 | 13/7 | 2.864 (2.249-3.516) | 3.161 (2.794-3.857) |
| >54.78 | ≤10.37 | 14/6 | 1.593 (1.194-1.932) | 1.895 (1.329-2.363) |
| >54.78 | >10.37 | 8/21 | 7.596 (7.031-7.917) | 7.849 (7.231-8.294) |
| Interactions | Additive model | RERI=4.122 (95%CI:-1.845-5.638),P>0.05 | ||
| AP=0.854 (95%CI:0.436-1.425),P<0.05 | ||||
| S=4.832 (95%CI:0.931-13.524),P>0.05 | ||||
| Multiplication model | OR=6.585 (95%CI:5.478-7.367),P<0.05 |
a, adjust for gender, age, disease duration, years of education, living area, father’ s educational attainment, mother’ s educational attainment, family structure, whether being the only child, whether having left-behind experience, boarding situation, trait coping style score, self-esteem score, psychological resilience score, depression score. RERI, relative excess risk due to interaction; AP, attributable proportion due to interaction; S, synergy index; OR, odds ratio. |
2.6 抑郁障碍在家庭创伤、校园霸凌与青少年自杀行为之间的调节作用
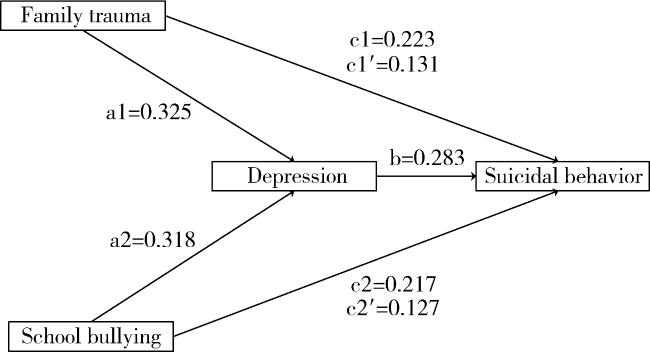
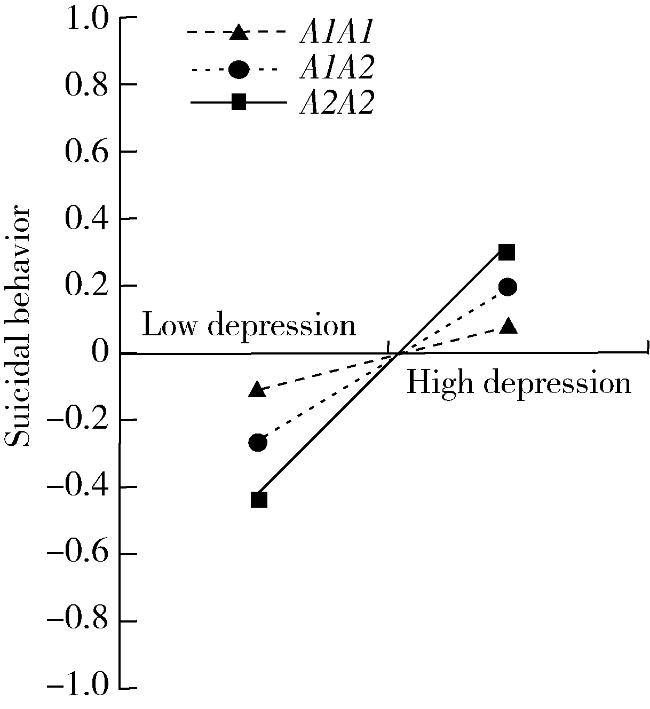
2.7 加性遗传模式下DRD2基因多态性的调节作用
表7 加性遗传模式下TaqⅠA调节家庭创伤、校园霸凌对自杀行为影响的回归分析Table 7 Regression analysis of TaqⅠA regulating the influence of family trauma and school bullying on suicide behavior under additive genetic model |
| Items | Equation 1 criterion: Depression | Equation 2 criterion: Suicidal behavior | |||||||
| β | SE | t | 95%CI | β | SE | t | 95%CI | ||
| Family trauma | 0.068 | 0.042 | 1.619 | -0.043-0.112 | 0.059 | 0.045 | 1.311 | -0.061-0.091 | |
| TaqⅠA | 0.051 | 0.051 | 1.000 | -0.065-0.128 | 0.044 | 0.055 | 0.800 | -0.058-0.112 | |
| Family trauma×TaqⅠA | 0.174 | 0.050 | 3.480 | 0.123-0.228 | 0.134 | 0.053 | 2.528 | -0.049-0.105 | |
| School bullying | 0.061 | 0.043 | 1.419 | -0.068-0.135 | 0.055 | 0.050 | 1.100 | -0.052-0.128 | |
| School bullying×TaqⅠA | 0.152 | 0.048 | 3.167 | 0.108-0.211 | 0.128 | 0.048 | 2.667 | -0.087-0.184 | |
| Depression | 0.298 | 0.046 | 6.478 | 0.231-0.348 | |||||
| Depression×TaqⅠA | 0.071 | 0.044 | 1.614 | 0.044-0.102 | |||||
| Control variables | |||||||||
| Non-suicidal self-injury | 0.097 | 0.043 | 2.256 | -0.055-0.159 | 0.072 | 0.038 | 1.895 | -0.033-0.064 | |
| Meaning of life | -0.069 | 0.051 | -1.353 | -0.123-0.074 | -0.051 | 0.040 | -1.275 | -0.098-0.031 | |
| R2 | 0.135 | 0.197 | |||||||
| F | 20.614 | 21.623 | |||||||
| P | <0.001 | <0.001 | |||||||
In the recessive inheritance pattern, the coding of TaqⅠA is A1A1 =0, A1A2 =1, A2A2 =2. |