Journal of Peking University (Health Sciences) ›› 2024, Vol. 56 ›› Issue (1): 120-130. doi: 10.19723/j.issn.1671-167X.2024.01.019

Previous Articles    

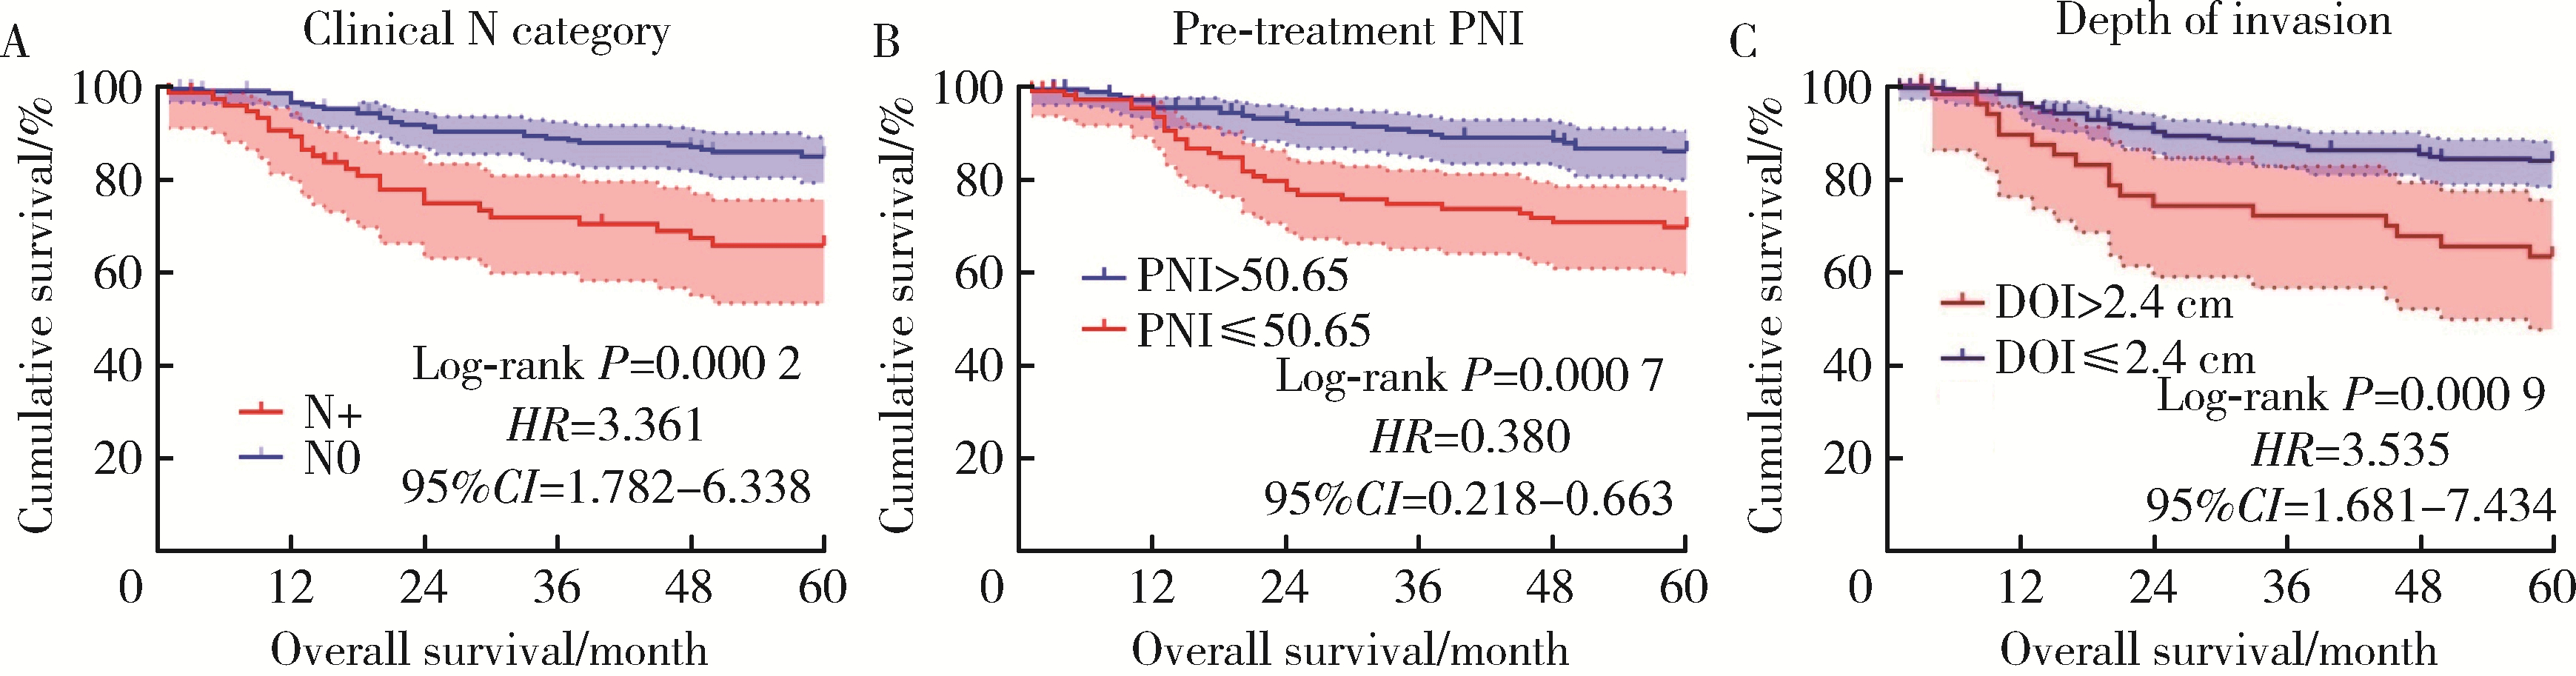
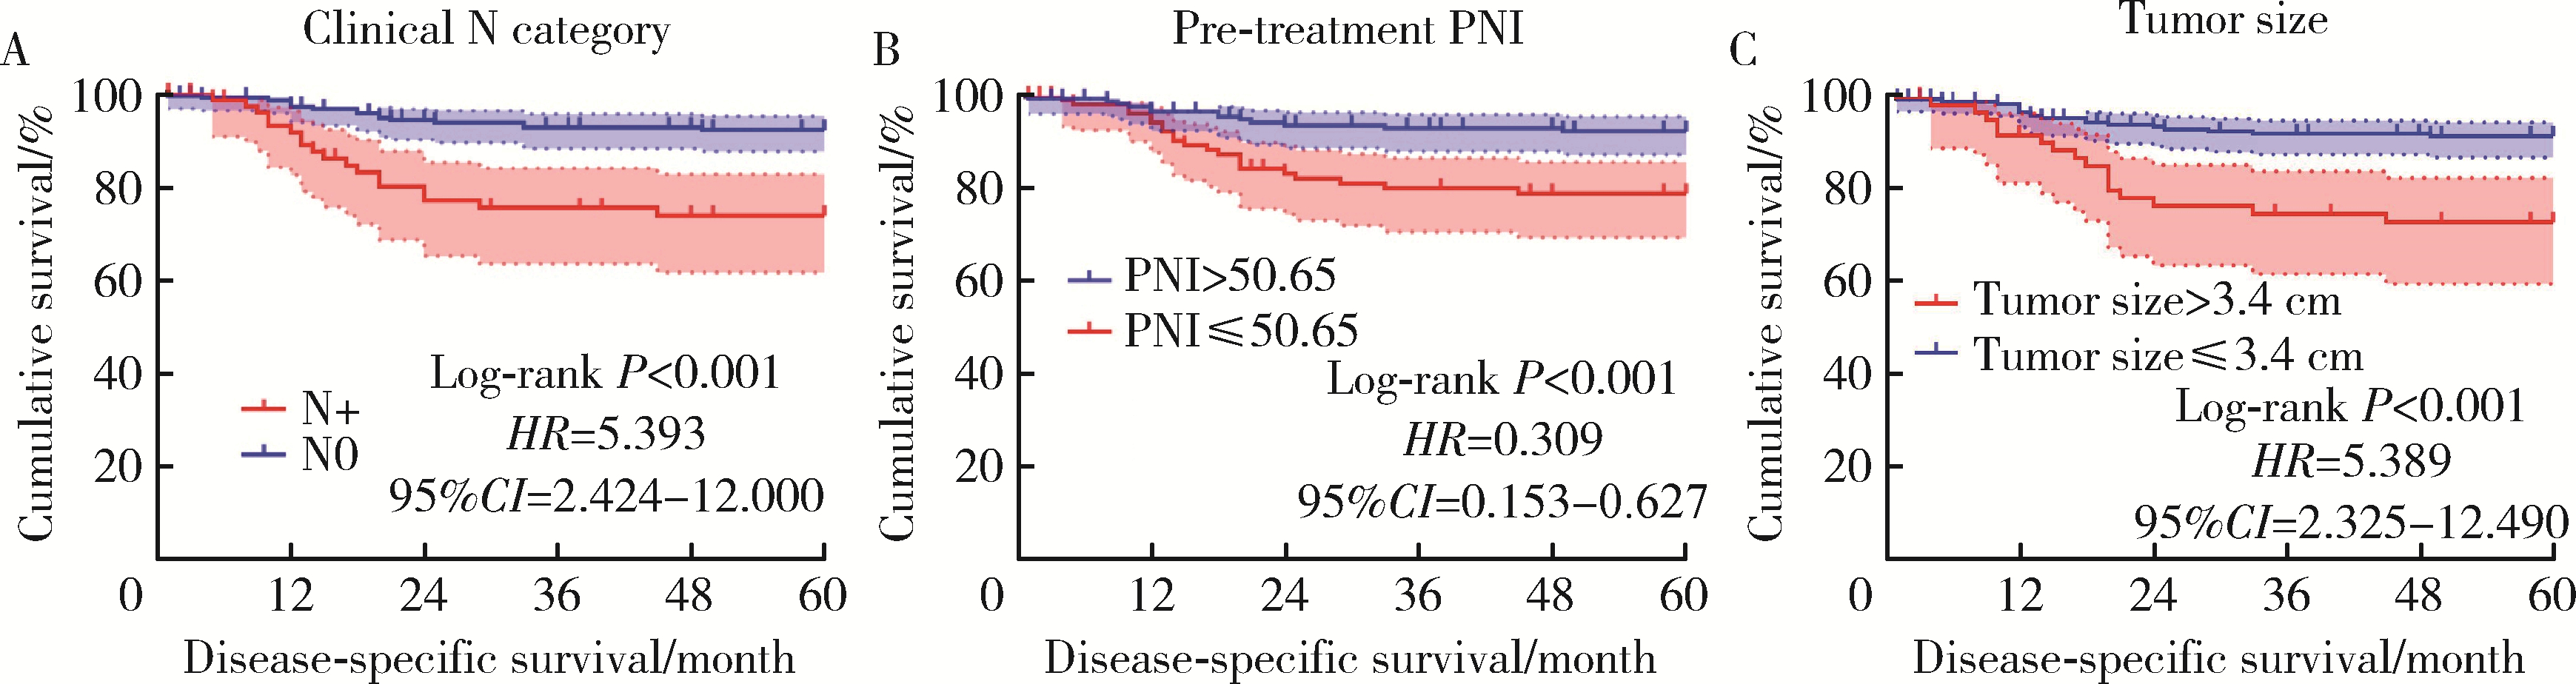
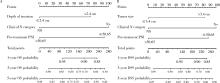
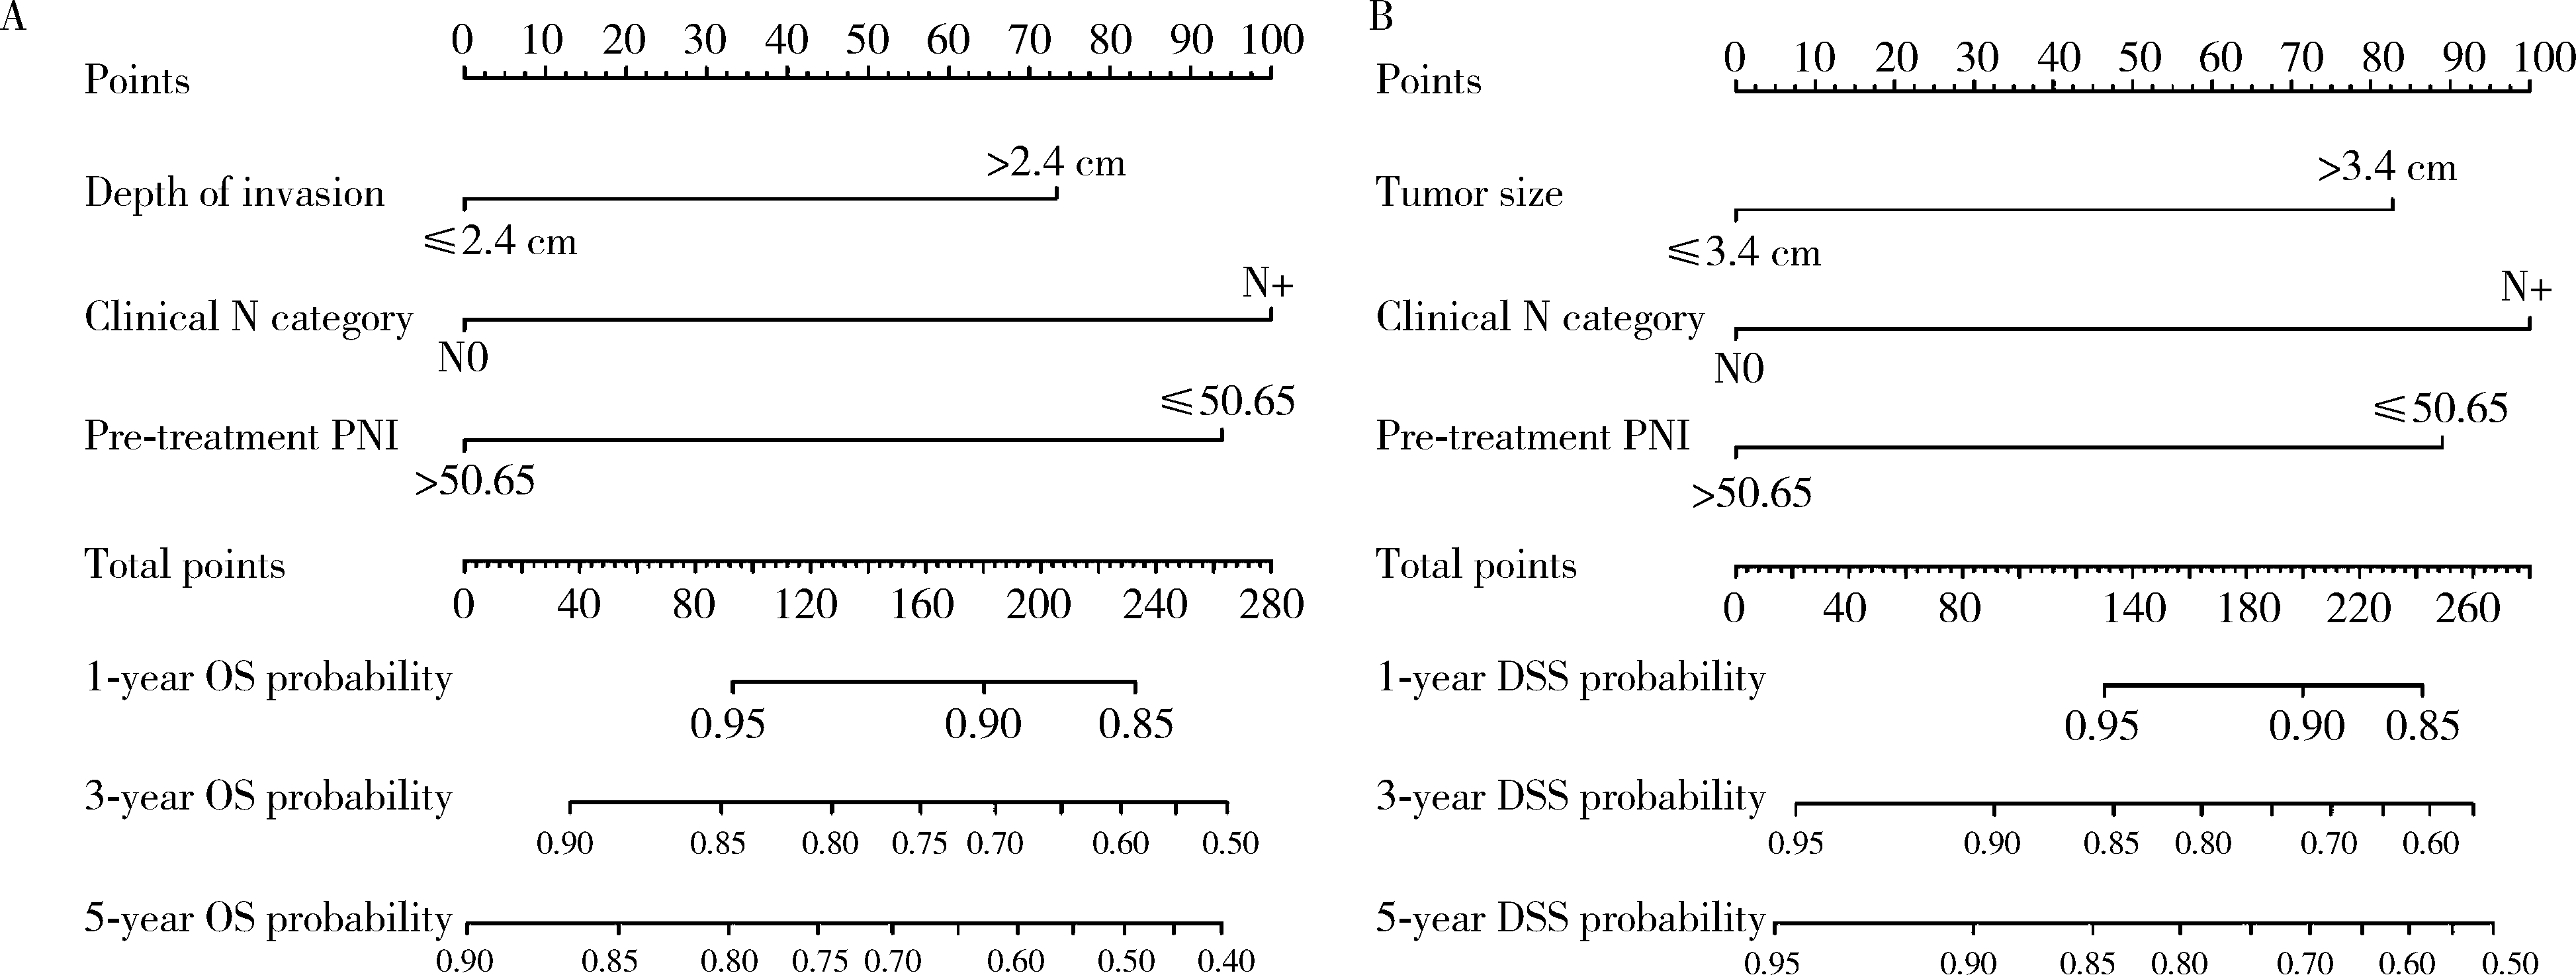
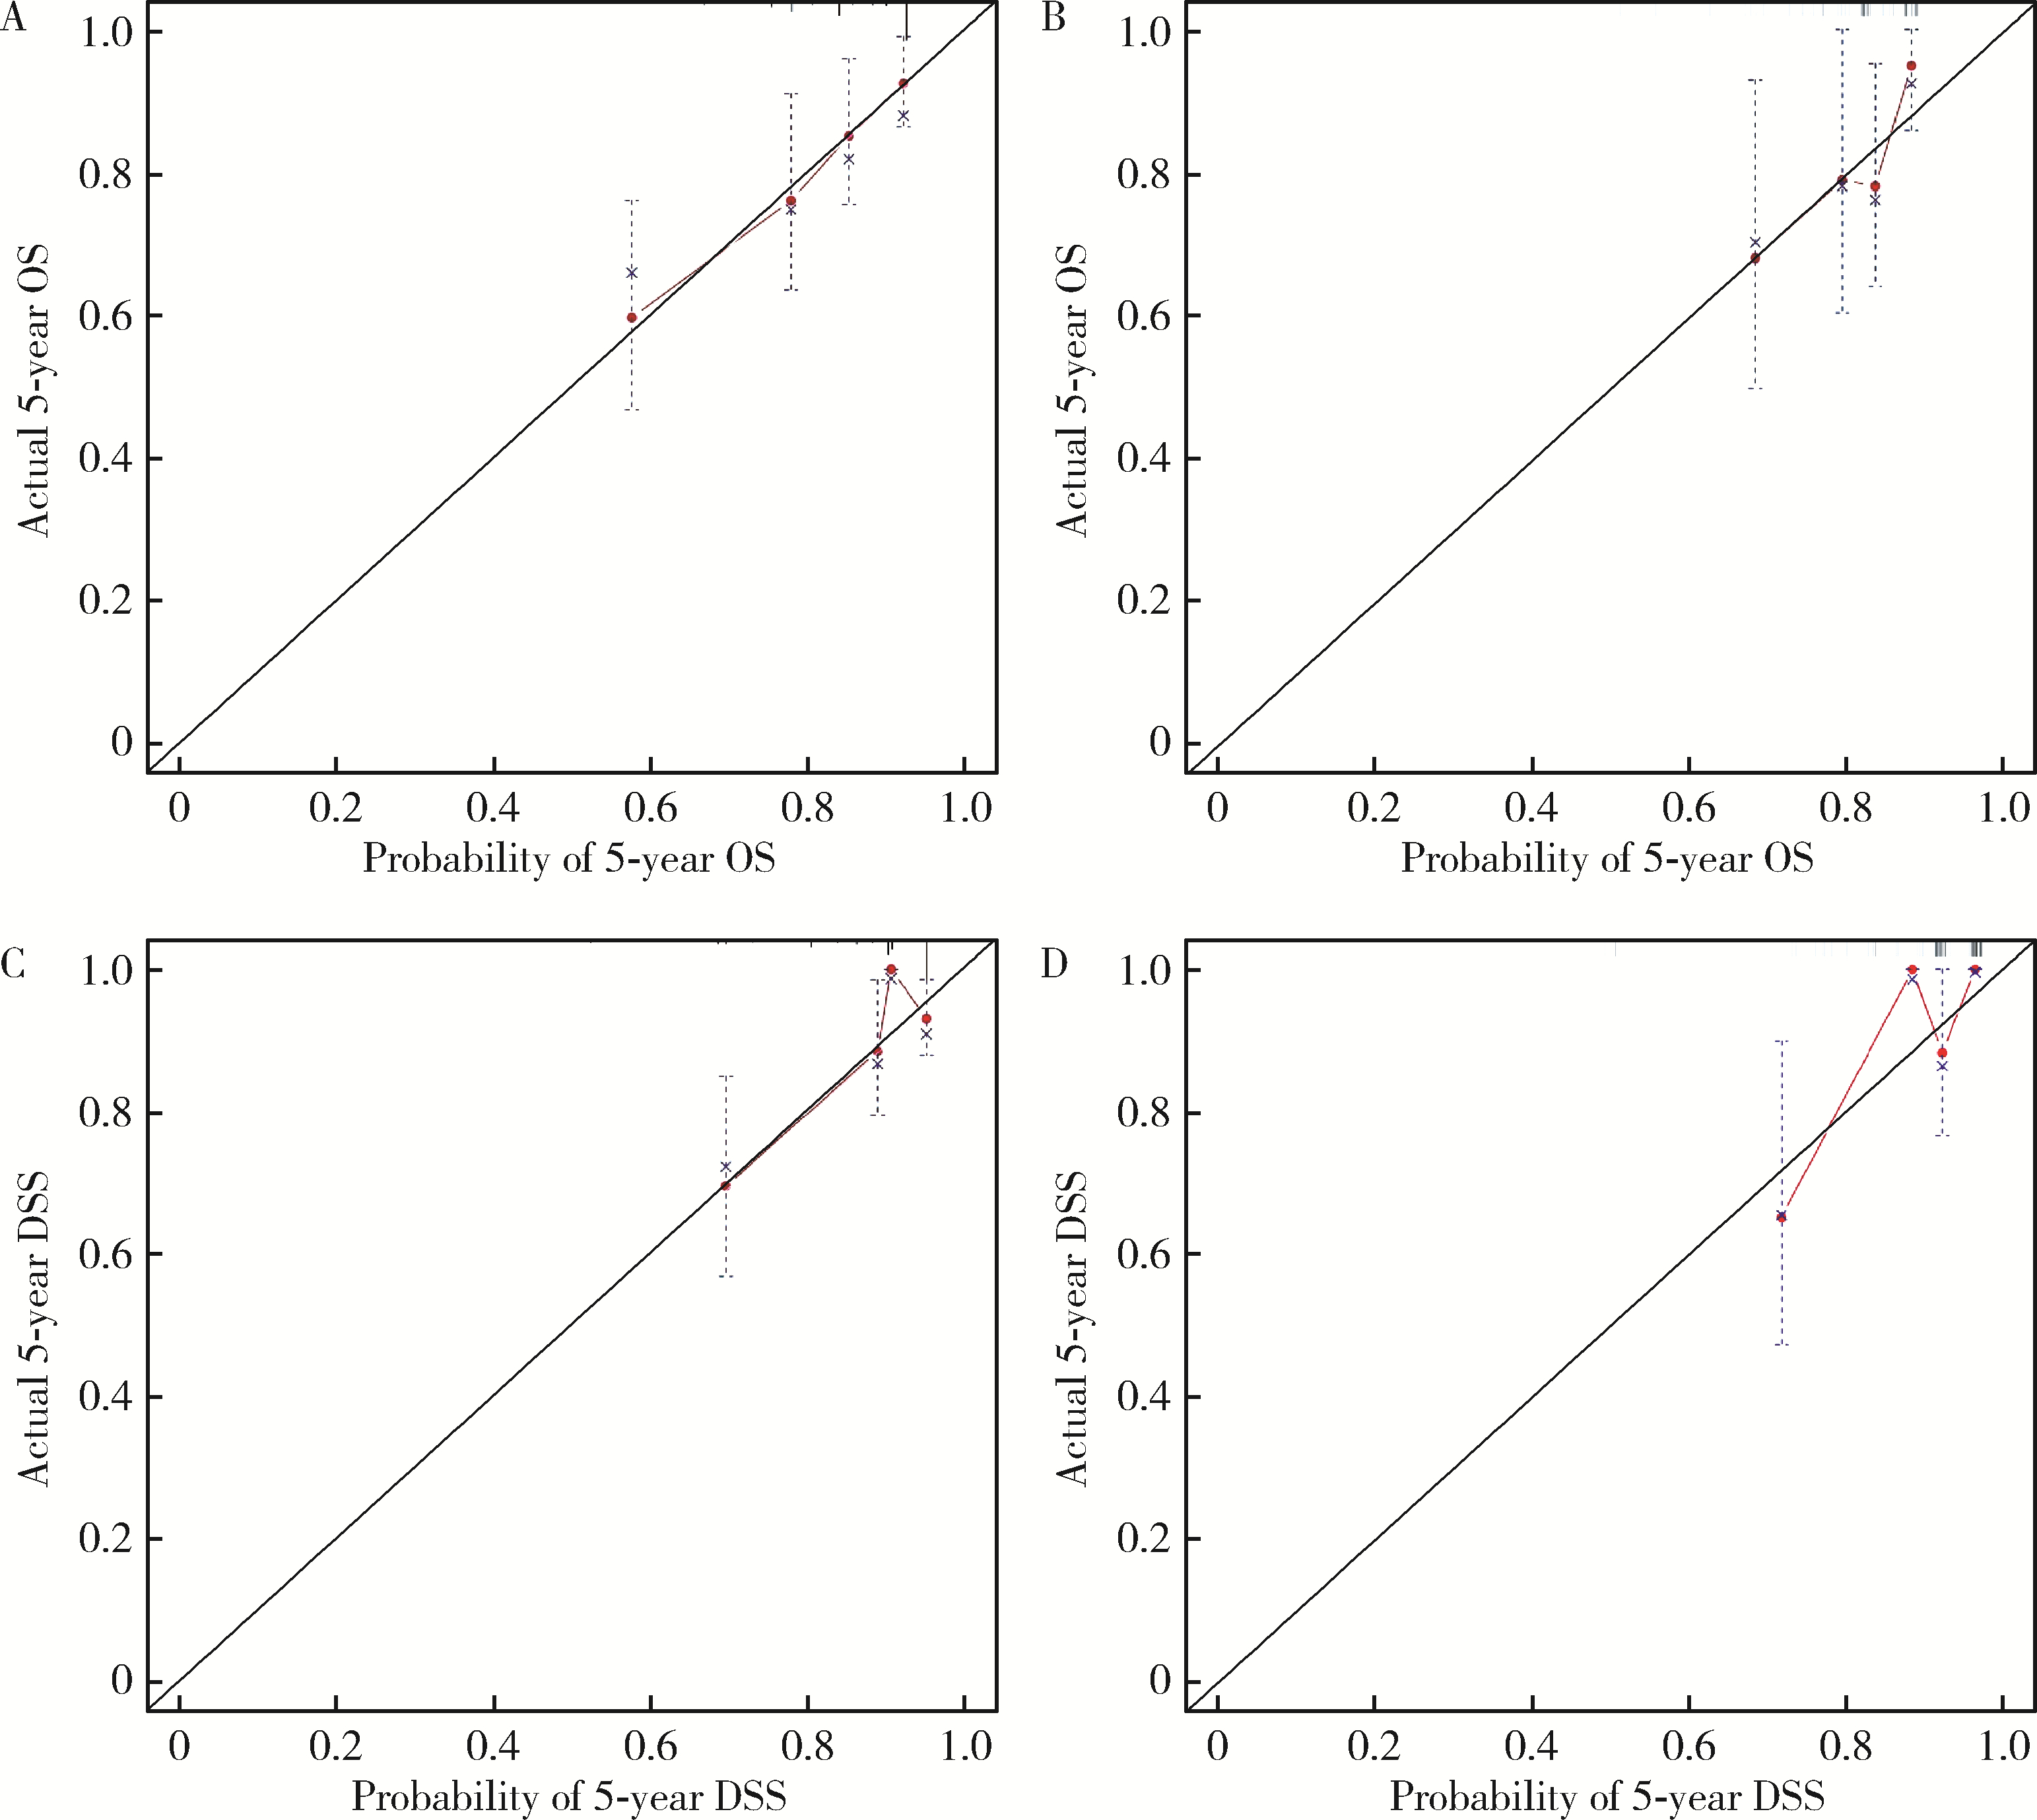
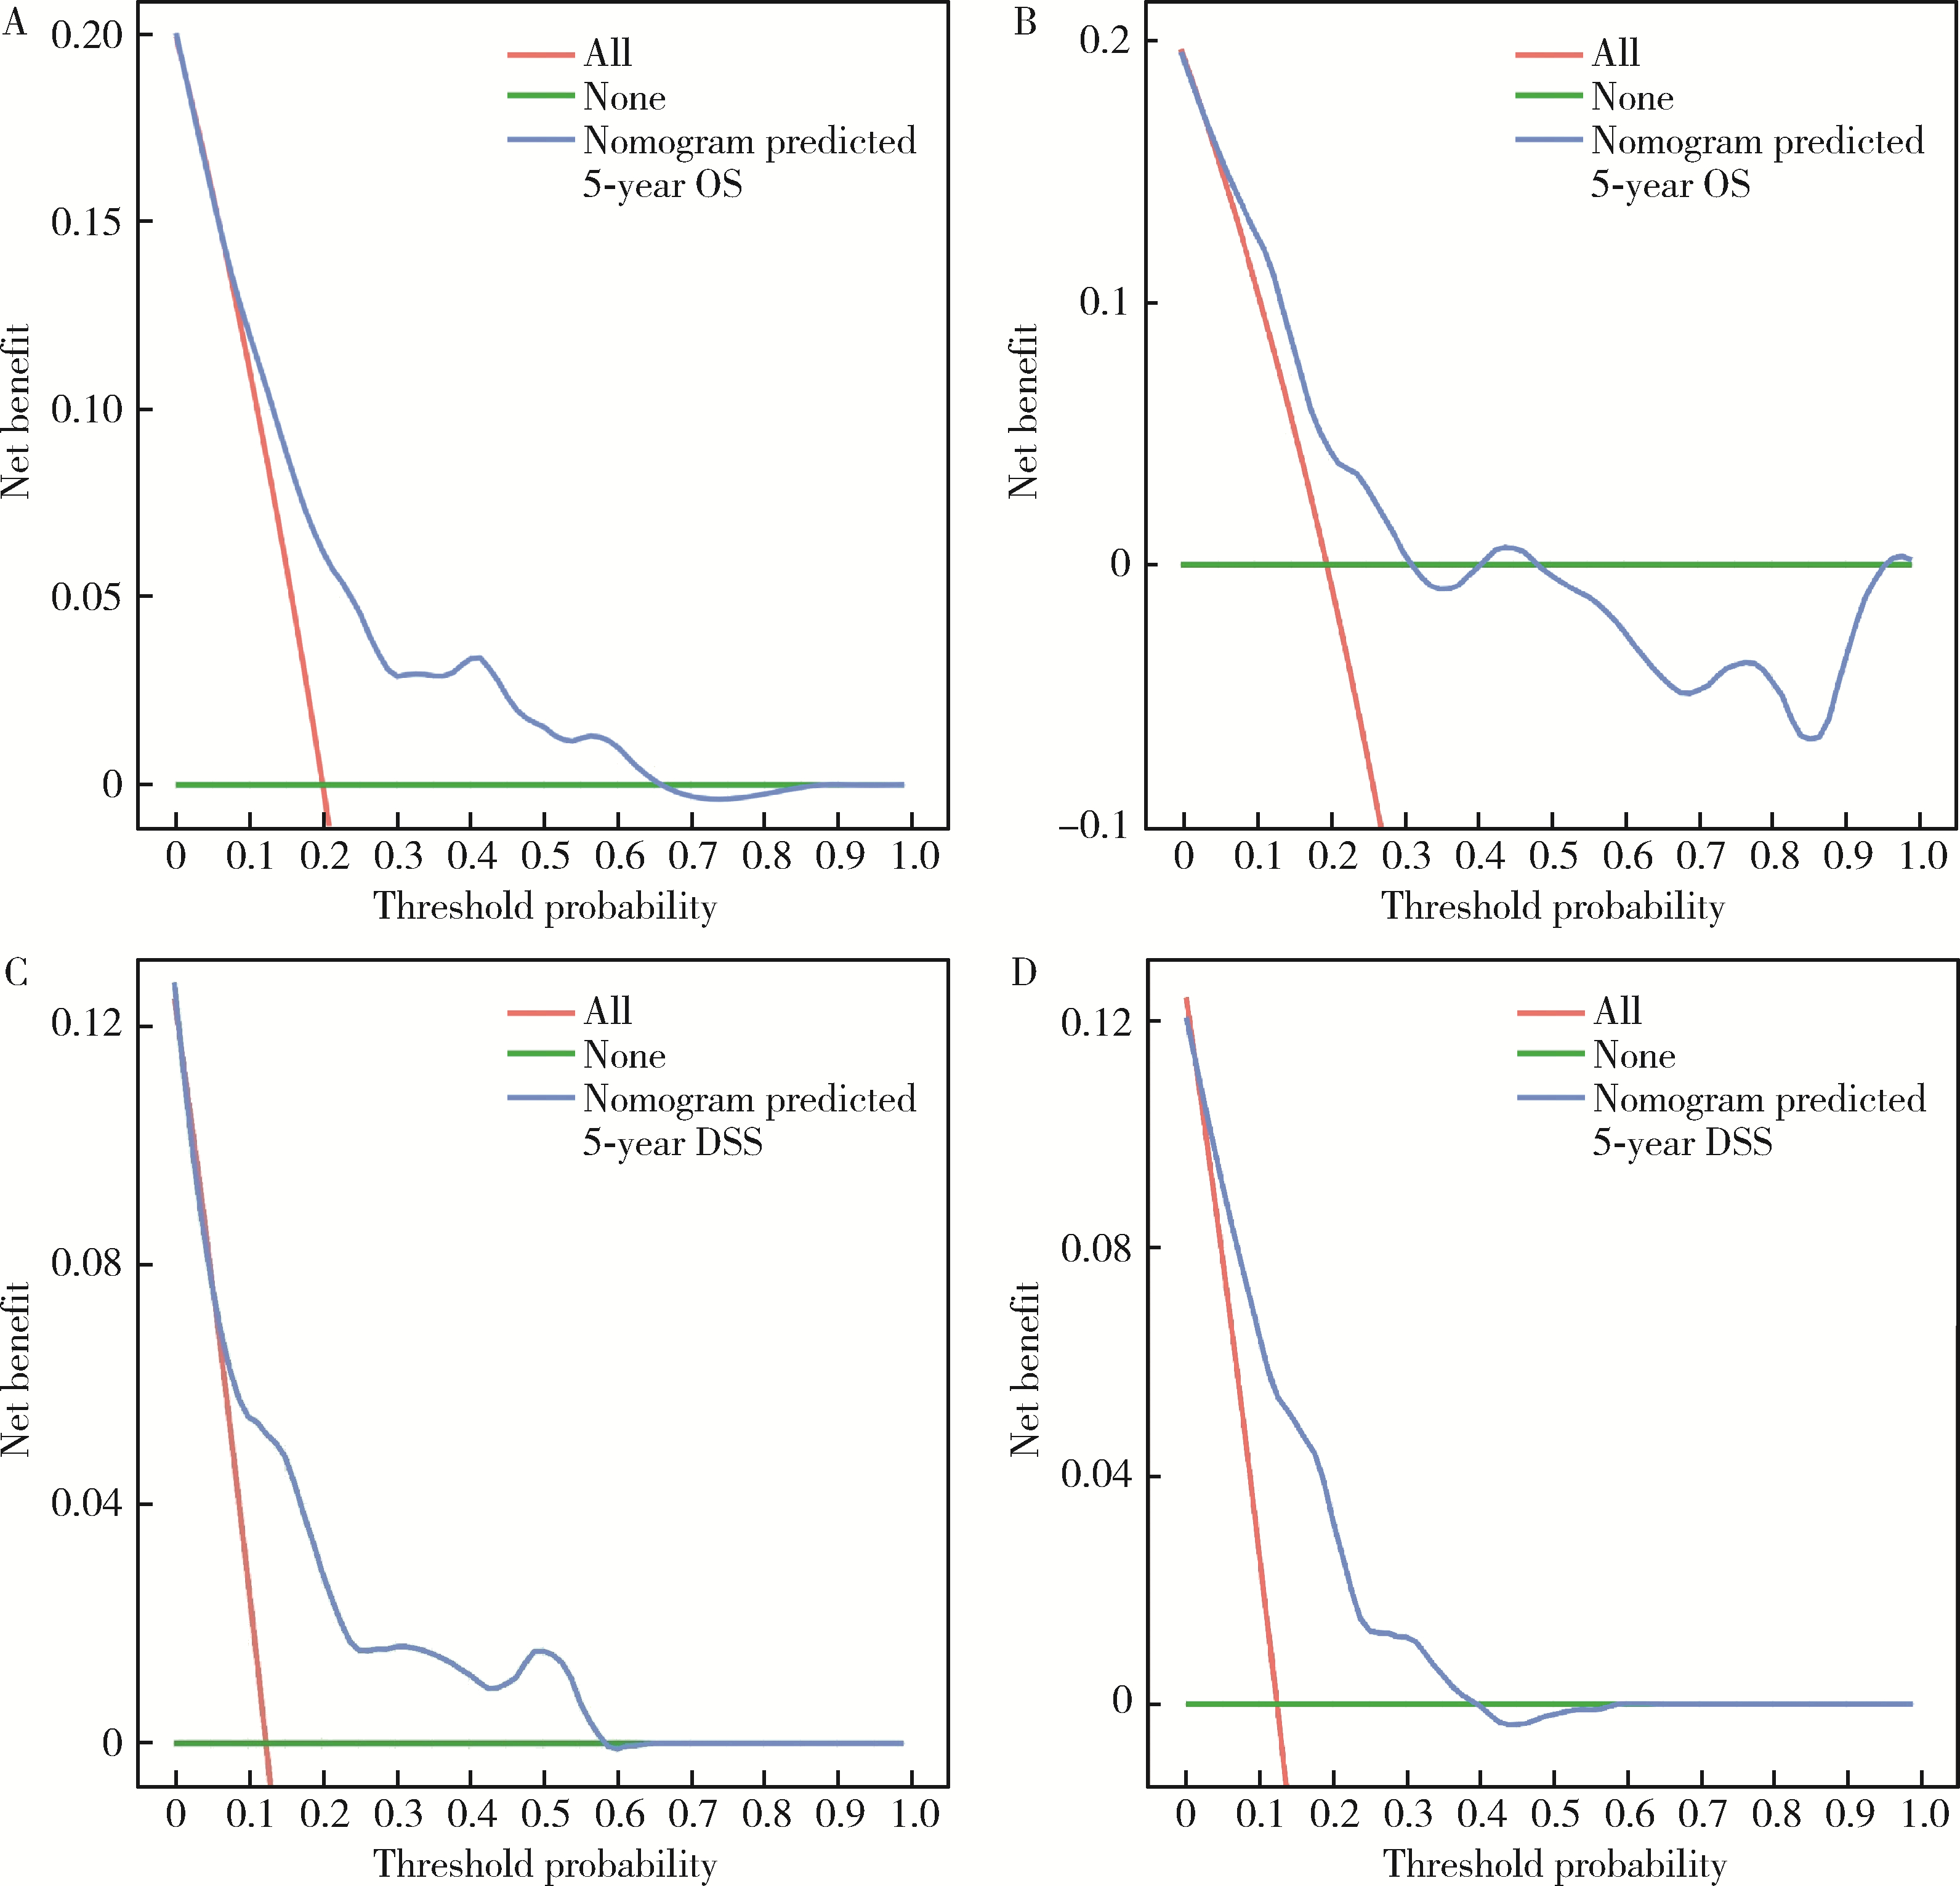
Establishment and verification of a prognostic nomogram for survival of tongue squamous cell carcinoma patients who underwent cervical dissection

Junqi SU1,Xiaoying WANG2,Zhiqiang SUN1,*()   

  1. 1. Department of Clinical Laboratory, Peking University School and Hospital of Stomatology & National Center for Stomatology & National Clinical Research Center for Oral Diseases & National Engineering Research Center of Oral Biomaterials and Digital Medical Devices, Beijing 100081, China
    2. Department of Medical Record, Peking University School and Hospital of Stomatology & National Center for Stomatology & National Clinical Research Center for Oral Diseases & National Engineering Research Center of Oral Biomaterials and Digital Medical Devices, Beijing 100081, China
  • Received:2023-08-30 Online:2024-02-18 Published:2024-02-06
  • Contact: Zhiqiang SUN E-mail:sunzhiqiang963@163.com

Abstract:

Objective: To evaluate the prognostic significance of inflammatory biomarkers, prognostic nutritional index and clinicopathological characteristics in tongue squamous cell carcinoma (TSCC) patients who underwent cervical dissection. Methods: The retrospective cohort study consisted of 297 patients undergoing tumor resection for TSCC between January 2017 and July 2018. The study population was divided into the training set and validation set by 7 :3 randomly. The peripheral blood indices of interest were preoperative neutrophil-to-lymphocyte ratio (NLR), lymphocyte-to-monocyte ratio (LMR), platelet-to-lymphocyte ratio (PLR), systemic immune-inflammation index (SII), systemic inflammation score (SIS) and prognostic nutritional index (PNI). Kaplan-Meier survival analysis and multivariable Cox regression analysis were used to evaluate independent prognostic factors for overall survival (OS) and disease-specific survival (DSS). The nomogram's accuracy was internally validated using concordance index, receiver operating characteristic (ROC) curve, area under the curve (AUC), calibration plot and decision curve analysis. Results: According to the univariate Cox regression analysis, clinical TNM stage, clinical T category, clinical N category, differentiation grade, depth of invasion (DOI), tumor size and pre-treatment PNI were the prognostic factors of TSCC. Multivariate Cox regression analysis revealed that pre-treatment PNI, clinical N category, DOI and tumor size were independent prognostic factors for OS or DSS (P < 0.05). Positive neck nodal status (N≥1), PNI≤50.65 and DOI > 2.4 cm were associated with the poorer 5-year OS, while a positive neck nodal status (N≥1), PNI≤50.65 and tumor size > 3.4 cm were associated with poorer 5-year DSS. The concordance index of the nomograms based on independent prognostic factors was 0.708 (95%CI, 0.625-0.791) for OS and 0.717 (95%CI, 0.600-0.834) for DSS. The C-indexes for external validation of OS and DSS were 0.659 (95%CI, 0.550-0.767) and 0.780 (95%CI, 0.669-0.890), respectively. The 1-, 3- and 5-year time-dependent ROC analyses (AUC = 0.66, 0.71 and 0.72, and AUC = 0.68, 0.77 and 0.79, respectively) of the nomogram for the OS and DSS pronounced robust discriminative ability of the model. The calibration curves showed good agreement between the predicted and actual observations of OS and DSS, while the decision curve confirmed its pronounced application value. Conclusion: Pre-treatment PNI, clinical N category, DOI and tumor size can potentially be used to predict OS and DSS of patients with TSCC. The prognostic nomogram based on these variables exhibited good accurary in predicting OS and DSS in patients with TSCC who underwent cervical dissection. They are effective tools for predicting survival and helps to choose appropriate treatment strategies to improve the prognosis.

Key words: Tongue squamous cell carcinoma, Prognostic nutritional index, Prognostic prediction model, Overall survival, Disease-specific survival, Nomogram

CLC Number: 

  • R739.8

Table 1

Demographic and clinicopathological characteristics of patients with TSCC"

Characteristics Total
(n=297)
Training cohort
(n=208)
Validation cohort
(n=89)
P value
Age /years
  ≤60 200 (67.34) 147 (70.67) 53 (59.55) 0.061
  >60 97 (32.66) 61 (29.33) 36 (40.45)
Gender
  Male 179 (60.27) 128 (61.54) 51 (57.30) 0.494
  Female 118 (39.73) 80 (38.46) 38 (42.70)
Alcohol consumption
  Current 85 (28.62) 58 (27.88) 27 (30.34) 0.668
  Former or never 212 (71.38) 150 (72.12) 62 (69.66)
Smoking
  Current 114 (38.38) 78 (37.50) 36 (40.45) 0.632
  Former or never 183 (61.62) 130 (62.50) 53 (59.55)
Clinical TNM stage
  Ⅰ-Ⅱ 203 (68.35) 145 (69.71) 58 (65.17) 0.441
  Ⅲ-Ⅳ 94 (31.65) 63 (30.29) 31 (34.83)
Clinical T category
  T1-T2 247 (83.16) 175 (84.13) 72 (80.90) 0.495
  T3-T4 50 (16.84) 33 (15.87) 17 (19.10)
Clinical N category
  N0 219 (73.74) 153 (73.56) 66 (74.16) 0.914
  N+ 78 (26.26) 55 (26.44) 23 (25.84)
Differentiation grade
  Well 82 (27.61) 61 (29.33) 21 (23.60) 0.311
  Moderate/poor 215 (72.39) 147 (70.67) 68 (76.40)
Depth of invasion
  ≤2.4 cm 248 (83.50) 174 (83.65) 74 (83.15) 0.914
  >2.4 cm 49 (16.50) 34 (16.35) 15 (16.85)
Tumor size
  ≤3.4 cm 235 (79.12) 165 (79.33) 70 (78.65) 0.896
  >3.4 cm 62 (20.88) 43 (20.67) 19 (21.35)
NLR
  ≤1.26 53 (17.85) 38 (18.27) 15 (16.85) 0.77
  >1.26 244 (82.15) 170 (81.73) 74 (83.15)
LMR
  ≤6.89 244 (82.15) 169 (81.25) 75 (84.27) 0.534
  >6.89 53 (17.85) 39 (18.75) 14 (15.73)
PLR
  ≤138.67 198 (66.67) 143 (68.75) 55 (61.80) 0.244
  >138.67 99 (33.33) 65 (31.25) 34 (38.20)
SII
  ≤301.54 76 (25.59) 50 (24.04) 26 (29.21) 0.349
  >301.54 221 (74.41) 158 (75.96) 63 (70.79)
PNI
  ≤50.65 113 (38.05) 73 (35.10) 40 (44.94) 0.109
  >50.65 184 (61.95) 135 (64.90) 49 (55.06)
SIS
  0 153 (51.52) 110 (52.88) 43 (48.31) 0.327
  1 114 (38.38) 80 (38.46) 34 (38.20)
  2 30 (10.10) 18 (8.65) 12 (13.48)

Table 2

Evaluation of immune-inflammation index and prognostic nutritional index of patients with TSCC"

Parameters Values, ${\bar x}$±s
White blood cell count
  Neutrophil/(×109/L) 3.76±1.34
  Lymphocyte/(×109/L) 1.98±0.63
  Monocyte/(×109/L) 0.40±0.14
  Platelet/(×109/L) 238.03±62.57
  Alb/(g/L) 42.42±3.45
Calculated ratios
  NLR 2.08±1.03
  LMR 5.39±2.12
  PLR 131.07±53.28
  SII 499.00±300.82
  PNI 52.33±4.99

Table 3

Cox regression for overall survival of patients with TSCC"

Variables Patients, n(%) Events, n(%) Univariate analysis Multivariate analysis
HR 95%CI P value HR 95%CI P value
Gender
  Male 179 (60.27) 33 (60.00) 1 (ref.)
  Female 118 (39.73) 22 (40.00) 0.979 0.571-1.679 0.938
Age /years
  ≤60 200 (67.34) 36 (65.45) 1 (ref.)
  >60 97 (32.66) 19 (34.55) 1.074 0.616-1.872 0.801
Alcohol consumption
  Current 85 (28.62) 19 (34.55) 1 (ref.)
  Former or never 212 (71.38) 36 (65.45) 0.702 0.403-1.224 0.212
Smoking
  Current 114 (38.38) 22 (40.00) 1 (ref.)
  Former or never 183 (61.62) 33 (60.00) 0.905 0.528-1.552 0.716
Clinical TNM stage
  Ⅰ-Ⅱ 203 (68.35) 31 (56.36) 1 (ref.)
  Ⅲ-Ⅳ 94 (31.65) 24 (43.64) 1.911 1.121-3.258 0.017* 0.442
Clinical T category
  T1-T2 247 (83.16) 42 (76.36) 1 (ref.)
  T3-T4 50 (16.84) 13 (23.64) 1.701 0.913-3.170 0.094 0.962
Clinical N category
  N0 219 (73.74) 31 (56.36) 1 (ref.) 1 (ref.)
  N+ 78 (26.26) 24 (43.64) 2.659 1.559-4.534 0.000* 2.277 1.319-3.930 0.003*
Differentiation grade
  Well 82 (27.61) 9 (16.36) 1 (ref.)
  Moderate/poor 215 (72.39) 46 (83.64) 2.156 1.055-4.405 0.035* 0.080
Depth of invasion
  ≤2.4 cm 248 (83.50) 38 (69.09) 1 (ref.) 1 (ref.)
  >2.4 cm 49 (16.50) 17 (30.91) 2.547 1.437-4.512 0.001* 1.829 1.013-3.302 0.045*
Tumor size
  ≤3.4 cm 235 (79.12) 35 (63.64) 1 (ref.)
  >3.4 cm 62 (20.88) 20 (36.36) 2.334 1.347-4.044 0.003* 0.410
NLR
  ≤1.26 53 (17.85) 14 (25.45) 1 (ref.)
  >1.26 244 (82.15) 41 (74.55) 0.593 0.323-1.088 0.092 0.110
LMR
  ≤6.89 244 (82.15) 50 (90.91) 1 (ref.)
  >6.89 53 (17.85) 5 (9.09) 0.420 0.168-1.054 0.065 0.192
PLR
  ≤138.67 198 (66.67) 40 (72.73) 1 (ref.)
  >138.67 99 (33.33) 15 (27.27) 0.760 0.420-1.375 0.364
SII
  ≤301.54 76 (25.59) 18 (32.73) 1 (ref.)
  >301.54 221 (74.41) 37 (67.27) 0.668 0.380-1.174 0.161
PNI
  ≤50.65 113 (38.05) 31 (56.36) 1 (ref.) 1 (ref.)
  >50.65 184 (61.95) 24 (43.64) 0.409 0.240-0.698 0.001* 0.462 0.269-0.793 0.005*
SIS
  0 153 (51.51) 27 (49.09) 1 (ref.)
  1 114 (38.38) 22 (40.00) 1.103 0.628-1.936 0.734
  2 30 (10.10) 6 (10.91) 1.101 0.455-2.667 0.831

Figure 1

Kaplan-Meier survival curves for OS in relation to clinical N category (A), pre-treatment PNI (B) and DOI (C) OS, overall survival; PNI, prognostic nutritional index; DOI, depth of invasion; HR, hazard ratio; CI, confidence interval."

Table 4

Cox regression for disease-specific survival of patients with TSCC"

Variables Patients, n(%) Events, n(%) Univariate analysis Multivariate analysis
HR 95%CI P value HR 95%CI P value
Gender
  Male 179 (60.27) 23 (67.65) 1 (ref.)
  Female 118 (39.73) 11 (32.35) 0.704 0.343-1.443 0.338
Age /years
  ≤60 200 (67.34) 23 (67.65) 1 (ref.)
  >60 97 (32.66) 11 (32.35) 0.976 0.476-2.001 0.946
Alcohol consumption
  Current 85 (28.62) 13 (38.24) 1 (ref.)
  Former or never 212 (71.38) 21 (61.76) 0.603 0.302-1.204 0.151
Smoking
  Current 114 (38.38) 16 (47.06) 1 (ref.)
  Former or never 183 (61.62) 18 (52.94) 0.681 0.347-1.335 0.263
Clinical TNM stage
  Ⅰ-Ⅱ 203 (68.35) 17 (50.00) 1 (ref.)
  Ⅲ-Ⅳ 94 (31.65) 17 (50.00) 2.414 1.232-4.731 <0.001* 0.300
Clinical T category
  T1-T2 247 (83.16) 24 (70.59) 1 (ref.)
  T3-T4 50 (16.84) 10 (29.41) 2.249 1.075-4.705 0.031* 0.744
Clinical N category
  N0 219 (73.74) 16 (47.06) 1 (ref.) 1 (ref.)
  N+ 78 (26.26) 18 (52.94) 3.744 1.908-7.348 <0.001* 2.783 1.373-5.640 0.005*
Differentiation grade
  Well 82 (27.61) 6 (17.65) 1 (ref.)
  Moderate/poor 215 (72.39) 28 (82.35) 1.936 0.801-4.676 0.142
Depth of invasion
  ≤2.4 cm 248 (83.50) 21 (61.76) 1 (ref.)
  >2.4 cm 49 (16.50) 13 (38.24) 3.463 1.734-6.916 <0.001* 0.278
Tumor size
  ≤3.4 cm 235 (79.12) 18 (52.94) 1 (ref.) 1 (ref.)
  >3.4 cm 62 (20.88) 16 (47.06) 3.530 1.800-6.925 <0.001* 2.336 1.148-4.751 0.019*
NLR
  ≤1.26 53 (17.85) 8 (23.53) 1 (ref.)
  >1.26 244 (82.15) 26 (76.47) 0.672 0.304-1.485 0.326
LMR
  ≤6.89 244 (82.15) 32 (94.12) 1 (ref.)
  >6.89 53 (17.85) 2 (5.88) 0.266 0.064-1.109 0.069 0.188
PLR
  ≤138.67 198 (66.67) 24 (70.59) 1 (ref.)
  >138.67 99 (33.33) 10 (29.41) 0.852 0.407-1.782 0.671
SII
  ≤301.54 76 (25.59) 10 (29.41) 1 (ref.)
  >301.54 221 (74.41) 24 (70.59) 0.798 0.382-1.670 0.550
PNI
  ≤50.65 113 (38.05) 21 (61.76) 1 (ref.) 1 (ref.)
  >50.65 184 (61.95) 13 (38.24) 0.335 0.168-0.670 0.002* 0.403 0.200-0.812 0.011*
SIS
  0 153 (51.51) 16 (47.06) 1 (ref.)
  1 114 (38.38) 13 (38.24) 1.104 0.531-2.295 0.791
  2 30 (10.10) 5 (14.70) 1.535 0.562-4.189 0.403

Figure 2

Kaplan-Meier survival curves for DSS in relation to clinical N category (A), pre-treatment PNI (B) and tumor size (C) DSS, disease-specific survival; PNI, prognostic nutritional index; HR, hazard ratio; CI, confidence interval."

Figure 3

Nomograms predicting 1-, 3- and 5-year probalilities for OS (A) and DSS (B) in patients with TSCC TSCC, tongue squamous cell carcinoma; OS, overall survival; DSS, disease-specific survival."

Figure 4

ROC analysis of nomogram for the OS and DSS in patients with TSCC A, time-dependent ROC curve for 1-, 3-, 5-year OS; B, time-dependent ROC curve for 1-, 3-, 5-year DSS. TSCC, tongue squamous cell carcinoma; OS, overall survival; DSS, disease-specific survival; ROC, receiver operating characteristic; AUC, area under the curve."

Figure 5

Nomogram model calibration curves for 5-year prediction for OS and DSS in patients with TSCC in training cohort and validation cohort A, 5-year for OS in the training set; B, 5-year for OS in the validation set; C, 5-year for DSS in the training set; D, 5-year for DSS in the validation set. TSCC, tongue squamous cell carcinoma; OS, overall survival; DSS, disease-specific survival."

Figure 6

Nomogram model decision curves for 5-year prediction for OS and DSS in patients with TSCC in training cohort and validation cohort A, 5-year for OS in the training set; B, 5-year for OS in the validation set; C, 5-year for DSS in the training set; D, 5-year for DSS in the validation set. TSCC, tongue squamous cell carcinoma; OS, overall survival; DSS, disease-specific survival."

1 Panarese I , Aquino G , Ronchi A , et al. Oral and oropharyngeal squamous cell carcinoma: Prognostic and predictive parameters in the etiopathogenetic route[J]. Expert Rev Anticancer Ther, 2019, 19 (2): 105- 119.
doi: 10.1080/14737140.2019.1561288
2 Faisal M , Abu Bakar M , Sarwar A , et al. Depth of invasion (DOI) as a predictor of cervical nodal metastasis and local recurrence in early stage squamous cell carcinoma of oral tongue (ESSCOT)[J]. PLoS One, 2018, 13 (8): e0202632.
doi: 10.1371/journal.pone.0202632
3 Ibrahim SA , Ahmed ANA , Elsersy HA , et al. Elective neck dissection in T1/T2 oral squamous cell carcinoma with N0 neck: Essential or not? A systematic review and meta-analysis[J]. Eur Arch Otorhinolaryngol, 2020, 277 (6): 1741- 1752.
doi: 10.1007/s00405-020-05866-3
4 Lu Z , Yan W , Liang J , et al. Nomogram based on systemic immune-inflammation index to predict survival of tongue cancer patients who underwent cervical dissection[J]. Front Oncol, 2020, 10, 341.
doi: 10.3389/fonc.2020.00341
5 Jia B , Dao J , Han J , et al. LINC00958 promotes the proliferation of TSCC via miR-211-5p/CENPK axis and activating the JAK/STAT3 signaling pathway[J]. Cancer Cell Int, 2021, 21 (1): 147.
doi: 10.1186/s12935-021-01808-z
6 Almangush A , Pirinen M , Youssef O , et al. Risk stratification in oral squamous cell carcinoma using staging of the eighth American Joint Committee on Cancer: Systematic review and meta-analysis[J]. Head Neck, 2020, 42 (10): 3002- 3017.
doi: 10.1002/hed.26344
7 Wei PY , Li WY , Tai SK . Discrete perineural invasion focus number in quantification for T1-T2 oral squamous cell carcinoma[J]. Otolaryngol Head Neck Surg, 2019, 160 (4): 635- 641.
doi: 10.1177/0194599818808510
8 Shi J , Bao X , Liu Z , et al. Serum miR-626 and miR-5100 are promising prognosis predictors for oral squamous cell carcinoma[J]. Theranostics, 2019, 9 (4): 920- 931.
doi: 10.7150/thno.30339
9 Romani C , Salviato E , Paderno A , et al. Genome-wide study of salivary miRNAs identifies miR-423-5p as promising diagnostic and prognostic biomarker in oral squamous cell carcinoma[J]. Theranostics, 2021, 11 (6): 2987- 2999.
doi: 10.7150/thno.45157
10 Zhang J , Hu Z , Horta CA , et al. Regulation of epithelial-mesenchymal transition by tumor microenvironmental signals and its implication in cancer therapeutics[J]. Semin Cancer Biol, 2023, 88, 46- 66.
doi: 10.1016/j.semcancer.2022.12.002
11 Mariani P , Russo D , Maisto M , et al. Pre-treatment neutrophil-to-lymphocyte ratio is an independent prognostic factor in head and neck squamous cell carcinoma: Meta-analysis and trial sequential analysis[J]. J Oral Pathol Med, 2022, 51 (1): 39- 51.
doi: 10.1111/jop.13264
12 Kumarasamy C , Tiwary V , Sunil K , et al. Prognostic utility of platelet-lymphocyte ratio, neutrophil-lymphocyte ratio and monocyte-lymphocyte ratio in head and neck cancers: A detailed PRISMA compliant systematic review and meta-analysis[J]. Cancers (Basel), 2021, 13 (16): 4166.
doi: 10.3390/cancers13164166
13 Xu X , Jing J . Inflammation-related parameter serve as prognostic biomarker in esophageal squamous cell carcinoma[J]. Front Oncol, 2022, 12, 900305.
doi: 10.3389/fonc.2022.900305
14 Wang Y , Lyu J , Jia H , et al. Clinical utility of the systemic immune-inflammation index for predicting survival in esophageal squamous cell carcinoma after radical radiotherapy[J]. Future Oncol, 2021, 17 (20): 2647- 2657.
doi: 10.2217/fon-2021-0304
15 Wang D , Hu X , Xiao L , et al. Prognostic nutritional index and systemic immune-inflammation index predict the prognosis of patients with HCC[J]. J Gastrointest Surg, 2021, 25 (2): 421- 427.
doi: 10.1007/s11605-019-04492-7
16 Murthy P , Zenati MS , Al Abbas AI , et al. Prognostic value of the systemic immune-inflammation index (SII) after neoadjuvant therapy for patients with resected pancreatic cancer[J]. Ann Surg Oncol, 2020, 27 (3): 898- 906.
doi: 10.1245/s10434-019-08094-0
17 Chang Y , An H , Xu L , et al. , Systemic inflammation score predicts postoperative prognosis of patients with clear-cell renal cell carcinoma[J]. Br J Cancer, 2015, 113 (4): 626- 633.
doi: 10.1038/bjc.2015.241
18 Kim MG , Choi YS , Youn SM , et al. Treatment outcomes and prognostic factors in oral tongue cancer: A 20-year retrospective study at the National Cancer Center, South Korea[J]. J Korean Assoc Oral Maxillofac Surg, 2022, 48 (4): 192- 200.
doi: 10.5125/jkaoms.2022.48.4.192
19 Wolfer S , Elstner S , Schultze-Mosgau S . Degree of keratinization is an independent prognostic factor in oral squamous cell carcinoma[J]. J Oral Maxillofac Surg, 2018, 76 (2): 444- 454.
doi: 10.1016/j.joms.2017.06.034
20 Ravasco P , Monteiro-Grillo I , Vidal PM , et al. Nutritional deterioration in cancer: The role of disease and diet[J]. Clin Oncol (R Coll Radiol), 2003, 15 (8): 443- 450.
doi: 10.1016/S0936-6555(03)00155-9
21 Jiang Y , Xu D , Song H , et al. Inflammation and nutrition-based biomarkers in the prognosis of oesophageal cancer: A systematic review and meta-analysis[J]. BMJ Open, 2021, 11 (9): e048324.
doi: 10.1136/bmjopen-2020-048324
22 Kono T , Sakamoto K , Shinden S , et al. Pre-therapeutic nutri-tional assessment for predicting severe adverse events in patients with head and neck cancer treated by radiotherapy[J]. Clin Nutr, 2017, 36 (6): 1681- 1685.
doi: 10.1016/j.clnu.2016.10.021
23 Yoshimura T , Suzuki H , Takayama H , et al. Prognostic value of inflammatory biomarkers in aged patients with oral squamous cell carcinoma[J]. Front Pharmacol, 2022, 13, 996757.
doi: 10.3389/fphar.2022.996757
24 Kubota K , Ito R , Narita N , et al. Utility of prognostic nutritional index and systemic immune-inflammation index in oral cancer treatment[J]. BMC Cancer, 2022, 22 (1): 368.
doi: 10.1186/s12885-022-09439-x
[1] Hai MAO,Fan ZHANG,Zhan-yi ZHANG,Ye YAN,Yi-chang HAO,Yi HUANG,Lu-lin MA,Hong-ling CHU,Shu-dong ZHANG. Predictive model of early urinary continence recovery based on prostate gland MRI parameters after laparoscopic radical prostatectomy [J]. Journal of Peking University (Health Sciences), 2023, 55(5): 818-824.
[2] Mei-ni ZUO,Yi-qing DU,Lu-ping YU,Xiang DAI,Tao XU. Correlation between metabolic syndrome and prognosis of patients with clear cell renal cell carcinoma [J]. Journal of Peking University (Health Sciences), 2022, 54(4): 636-643.
[3] DING Ting-ting,ZENG Chu-xiong,HU Li-na,YU Ming-hua. Establishment of a prediction model for colorectal cancer immune cell infiltration based on the cancer genome atlas (TCGA) database [J]. Journal of Peking University (Health Sciences), 2022, 54(2): 203-208.
[4] Wen-peng WANG,Jie-fu WANG,Jun HU,Jun-feng WANG,Jia LIU,Da-lu KONG,Jian LI. Clinicopathological features and prognosis of colorectal stromal tumor [J]. Journal of Peking University (Health Sciences), 2020, 52(2): 353-361.
[5] LIU Yu-qing, LU Jian, HAO Yi-chang, XIAO Chun-lei, MA Lu-lin. Predicting model based on risk factors for urosepsis after percutaneous nephrolithotomy [J]. Journal of Peking University(Health Sciences), 2018, 50(3): 507-513.
Viewed
Full text


Abstract

Cited

  Shared   
  Discussed   
No Suggested Reading articles found!