
1 资料与方法
1.1 研究对象
1.2 研究方法
1.2.1 观察指标
1.2.2 并发症的定义
1.2.3 PEG操作前注意事项
1.2.4 主要仪器与耗材
1.2.5 PEG操作
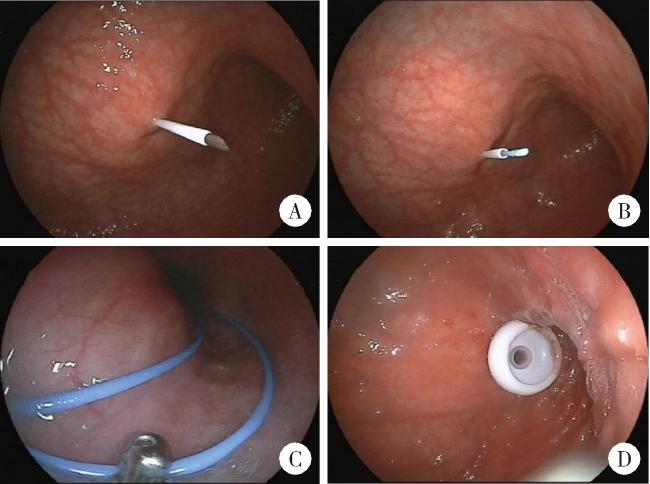
图1 应用牵引法行内镜下胃造瘘术Figure 1 Percutaneous endoscopic gastrostomy (PEG) using the pull technique A, puncture needle with plastic sheath into abdominal and gastric walls; B, the needle was removed and the guide wire was inserted through the plastic sheath; C, biopsy forceps grasping guidewire through the endoscopic channel; D, PEG tube was placed by the pull technique using an internal bumper. |
1.2.6 PEG术后注意事项
1.3 统计学分析
2 结果
2.1 入组患者的一般资料
2.2 患者术后并发症
表1 PEG术后14 d内的并发症Table 1 Complications after PEG tube placement within 14 days |
| Complications within 14 days | n |
| Minor complications | |
| Post-operative fever (prophylactic antibiotics) | 27 |
| Without evident infection | 16 |
| Respiratory tract infection | 7 |
| Peristomal wound infection | 4 |
| Tube dislodgement | 0 |
| Benign pneumoperitoneum | 0 |
| Major complications | |
| Post-operative fever (upgraded antibiotics)) | 13a |
| Respiratory tract infection | 11a |
| Peristomal wound infection | 2 |
| Hemorrhage | 0 |
| Injury to internal organs | 0 |
| Buried bumper syndrome | 0 |
| Respiratory failure | 2a |
| Death | 2a |
a,one patient had more than two complications at the same time;PEG,percutaneous endoscopic gastrostomy. |
2.2.1 有并发症组和无并发症组的比较分析
表2 有无并发症的两组患者组间数据比较分析Table 2 Descriptive statistics and bivariate comparisons of patients who had complication vs. non-complication |
| Items | Complication (n=46) | Non-complication (n=146) | Statistics (χ2/t/z) | P |
| Male, n (%) | 25 (54) | 72 (49) | 0.354 | 0.552 |
| Site of disease onset (bulbar), n (%) | 21 (46) | 72 (49) | 0.188 | 0.665 |
| Age at disease onset /years, $\bar x \pm s$ | 54±11 | 56±12 | 0.897 | 0.572 |
| Diagnose delay/months, M (P25, P75) | 12 (7, 18) | 12 (6, 24) | -0.192 | 0.848 |
| ALSFRS, $\bar x \pm s$ | 24±10 | 24±10 | -0.247 | 0.805 |
| Interval from disease onset to PEG/months, M (P25, P75) | 25 (17, 39) | 26 (18, 40) | -0.329 | 0.742 |
| Laboratory data, $\bar x \pm s$ | ||||
| Albumin/(g/L) | 41.5±4.1 | 41.2±3.2 | 0.512 | 0.610 |
| Creatinine/(μmol/L) | 61.0±18.6 | 60.0±18.0 | 0.327 | 0.744 |
| Sodium/(mmol/L) | 140.5±2.4 | 139.9±8.9 | 0.388 | 0.698 |
| Potassium/(mmol/L) | 3.8±0.3 | 3.9±0.3 | -1.247 | 0.214 |
| Triglyceride/(mmol/L) | 1.5±0.7 | 1.3±0.6 | 1.442 | 0.223 |
| Transnasal gastroscopy, n (%) | 34 (73) | 107 (73) | 0.007 | 0.933 |
| Operation time/min, $\bar x \pm s$ | 16±5 | 13±5 | 3.606 | 0.000 |
| Hospital days, M(P25, P75) | 6 (5, 9) | 5 (3, 7) | 2.692 | 0.009 |
ALSFRS, amyotrophic lateral sclerosis functional rating scale;PEG, percutaneous endoscopic gastrostomy. |
2.2.2 轻度并发症亚组和严重并发症亚组比较分析
表3 轻度并发症组与严重并发症组间的数据比较分析Table 3 Descriptive statistics and bivariate comparison of patients who had minor complication vs. major complication |
| Items | Minor complication (n=33) | Major complication (n=13) | Statistics (χ2/t/z) | P |
| Male, n (%) | 20 (61) | 5 (39) | 1.843 | 0.175 |
| Site of disease onset (bulbar), n (%) | 18 (55) | 3 (23) | 3.722 | 0.054 |
| Age at disease onset/years,$\bar x \pm s$ | 56±12 | 51±10 | 1.368 | 0.178 |
| Diagnose delay (months), M (P25, P75) | 12 (9, 20) | 11 (5, 18) | -0.880 | 0.379 |
| ALSFRS,$\bar x \pm s$ | 25±10 | 23±11 | 0.438 | 0.664 |
| Interval from disease onset to PEG/months, M (P25, P75) | 25 (15, 35) | 25(19, 65) | -1.000 | 0.317 |
| Laboratory data, $\bar x \pm s$ | ||||
| Albumin/(g/L) | 42.2±3.3 | 39.6±5.4 | 1.915 | 0.062 |
| Creatinine/(μmol/L) | 66.8±16.4 | 46.5±16.2 | 3.788 | 0.000 |
| Sodium/(mmol/L) | 140.7±2.6 | 139.9±1.7 | 1.004 | 0.321 |
| Potassium/(mmol/L) | 3.8±0.3 | 3.9±0.4 | -0.889 | 0.379 |
| Triglyceride/(mmol/L) | 1.6±0.7 | 1.1±0.5 | 2.148 | 0.038 |
| Transnasal gastroscopy, n (%) | 24 (73) | 10 (77) | N/A | >0.999 |
| Operation time/min, $\bar x \pm s$ | 15±5 | 20±5 | -3.336 | 0.002 |
| Hospital days, M(P25, P75) | 6 (5, 8) | 5 (4, 14) | -0.841 | 0.400 |
ALSFRS,amyotrophic lateral sclerosis functional rating scale; PEG,percutaneous endoscopic gastrostomy;N/A, not applicable. |
2.2.3 并发症相关危险因素的Logistic回归分析
表4 并发症相关危险因素的多变量分析Table 4 Multivariate analysis of risk factors related complications |
| Predictors | OR | 95%CI | P |
| Site of disease onset | 0.889 | 0.406-1.946 | 0.769 |
| Albumin | 1.020 | 0.907-1.146 | 0.743 |
| Creatinine | 0.727 | 0.975-1.018 | 0.727 |
| Triglyceride | 1.453 | 0.834-2.532 | 0.187 |
| Operation time | 1.132 | 1.051-1.220 | 0.001 |