
1 资料与方法
1.1 病例选择
1.2 数据收集
1.3 牙周检查和治疗程序
1.4 疗效评价标准
1.5 统计学分析
2 结果
2.1 患者一般情况
表1 抗生素组和非抗生素组的基线比较Table 1 Comparison between the antibiotic group and the non-antibiotic group at T0 |
| Antibiotic | No (n=317) | Yes (n=204) | P |
| Age/years | 42.00 (33.00,50.00) | 35.00 (29.75,43.00) | < 0.001 |
| Gender | 0.301 | ||
| Male | 175 (55.21) | 122 (59.80) | |
| Female | 142 (44.79) | 82 (40.20) | |
| Smoke | 0.655 | ||
| No/former smokers | 269 (84.86) | 176 (86.27) | |
| Current smokers | 48 (15.14) | 28 (13.73) | |
| Diabetes | 0.108 | ||
| No | 304 (95.90) | 189 (92.65) | |
| Yes | 13 (4.10) | 15 (7.35) | |
| Stage | < 0.001 | ||
| Ⅲ | 247 (77.92) | 111 (54.41) | |
| Ⅳ | 70 (22.08) | 93 (45.59) | |
| Number of teeth | 27.00 (26.00,28.00) | 27.00 (25.00,28.00) | 0.631 |
| PD≥5 mm/% | 27.78 (14.81,44.23) | 53.03 (37.64,67.27) | < 0.001 |
| PD/mm | 3.57 (3.08,4.16) | 4.43 (3.81,5.02) | < 0.001 |
| BOP% | 98.21 (89.29,100.00) | 100.00 (100.00,100.00) | < 0.001 |
| BI | 2.95 (2.38,3.52) | 3.39 (2.92,3.86) | < 0.001 |
| Interval of re-evaluation/months | 2.57 (2.17,3.17) | 2.70 (2.19,3.33) | 0.255 |
Data are M(Q1, Q3) or n(%). PD, probing depth; BOP, bleeding on probing; BI, bleeding index. |
2.2 两组患者治疗前后的临床指标变化
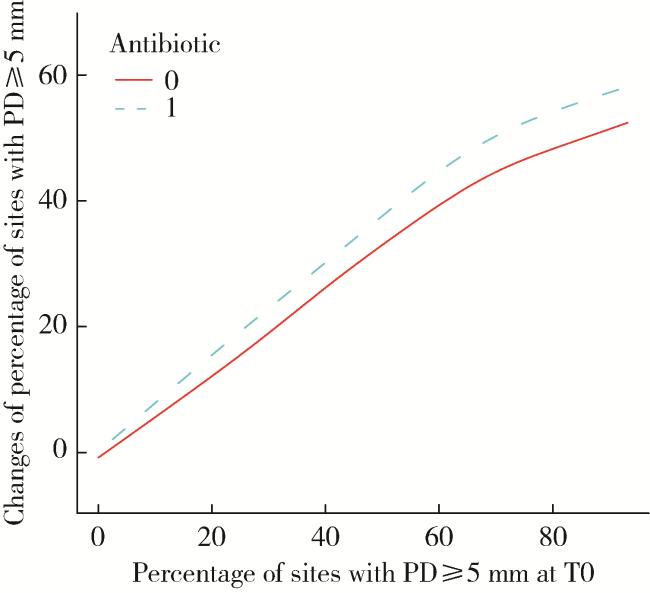
图1 T0时PD≥5 mm位点百分比与PD≥5 mm位点百分比变化的平滑曲线图Figure 1 Smoothing plot of percentage of sites with PD≥5 mm at T0 and changes of percentage of sites with PD≥5 mm in both antibiotic group and non-antibiotic group This model was adjusted for age, gender, diabetes, and interval of reevaluation. The non-antibiotic and antibiotic groups are represented by the red and blue lines, respectively. PD, probing depth. |
2.3 各因素与疗效的单因素分析
表2 各因素与PD≥5 mm位点百分比变化的单因素回归分析Table 2 Univariable regression analysis for the changes of percentage of sites with PD≥5 mm |
| Covariate | Statistics | β (95%CI) | P |
| Age/years | 39.00 (31.00, 48.00) | -0.37 (-0.51, -0.24) | < 0.001 |
| Gender | |||
| Male | 297 (57.01) | 0 | |
| Female | 224 (42.99) | -3.23 (-6.42, -0.03) | 0.048 |
| Smoke | |||
| No/Former smokers | 445 (85.41) | 0 | |
| Current smokers | 76 (14.59) | -0.07 (-4.56, 4.43) | 0.977 |
| Diabetes | |||
| No | 493 (94.63) | 0 | |
| Yes | 28 (5.37) | 0.36 (-6.68, 7.40) | 0.920 |
| Stage | |||
| Ⅲ | 358 (68.71) | 0 | |
| Ⅳ | 163 (31.29) | 5.72 (2.33, 9.10) | 0.001 |
| Interval of re-evaluation/months | 2.60 (2.17, 3.23) | 5.67 (3.48, 7.85) | < 0.001 |
| Antibiotic | |||
| No | 317 (60.84) | 0 | |
| Yes | 204 (39.16) | 18.09 (15.23, 20.94) | < 0.001 |
Data are M(Q1, Q3) or n(%). PD, probing depth. |
2.4 抗生素使用与疗效的多因素分析
2.5 年龄对抗生素组疗效的影响
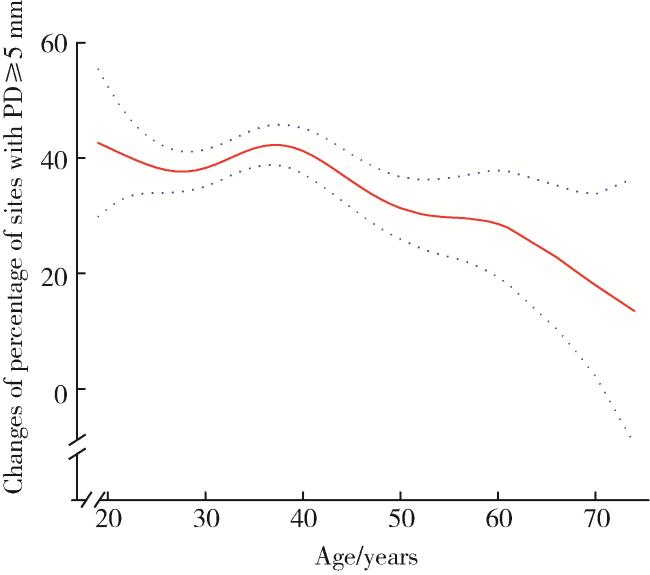


图2 抗生素组年龄和PD≥5 mm位点百分比变化的平滑曲线图Figure 2 Smoothing plot of age and changes of percentage of sites with PD≥5 mm in antibiotic group This model was adjusted for gender, smoke, diabetes, stage and interval of re-evaluation. The red line represents the best-fit line, and the blue lines are 95% confidence intervals. PD, probing depth. |
表3 抗生素组年龄和用药时机与PD≥5 mm位点百分比变化的多因素回归分析Table 3 Multivariable regression analysis of age and timing of antibiotic use on the changes of percentage of sites with PD≥5 mm in antibiotic group |
| Variable | Crude model | Model Ⅰ | Model Ⅱ | |||||
| β (95%CI) | P | β (95%CI) | P | β (95%CI) | P | |||
| Age/years | ||||||||
| >38 | 0 | 0 | 0 | |||||
| ≤38 | 6.34 (1.47, 11.20) | 0.011 | 6.58 (1.29, 11.86) | 0.016 | 6.17 (0.94, 11.39) | 0.022 | ||
| Timing | ||||||||
| Before SRP | 0 | 0 | 0 | |||||
| During SRP | 10.74 (4.66, 16.82) | < 0.001 | 10.61 (4.488, 16.74) | < 0.001 | 9.53 (3.39, 15.67) | 0.003 | ||
| After SRP | 6.07 (-0.61, 12.75) | 0.077 | 5.82 (-0.92, 12.57) | 0.092 | 4.26 (-2.46, 10.99) | 0.215 | ||
PD, probing depth; CI, confidence interval; SRP, scaling and root planing. Crude model, not adjusted for other covariates; Model Ⅰ, adjusted for gender, smoke and diabetes; Model Ⅱ, adjusted for gender, smoke, diabetes, stage and interval of re-evaluation. |