
1 资料与方法
1.1 样本采集及选择性培养
1.2 分离培养与鉴定
1.3 野生株V. parvula与标准株V. parvula生长曲线及乳酸代谢能力测定
1.4 细菌生物膜的培养、形态结构观察及代谢产物分析
1.4.1 细菌生物膜的培养
1.4.2 扫描电镜下观察细菌生物膜的形态结构
1.4.3 细菌生物膜结晶紫染色
1.4.4 测定菌液中的乳酸浓度及pH值
1.5 统计学分析
2 结果
2.1 临床分离株的形态学特征及16S rRNA测序结果
2.1.1 临床分离株的形态学特征
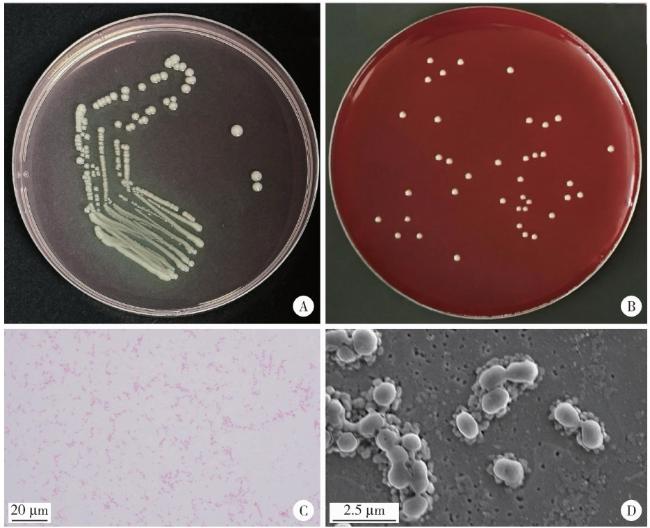
图1 临床分离株的菌落形态Figure 1 Images of the clinically isolated strain A, colony morphology of the clinically isolated strain in the selective Veillonella agar; B, colony morphology of the clinically isolated strain in the blood agar; C, Gram stain results of the clinically isolated strain (×1 000); D, scanning electron microscope image of the clinically isolated strain (×10 000). |
2.1.2 16S rRNA测序鉴定
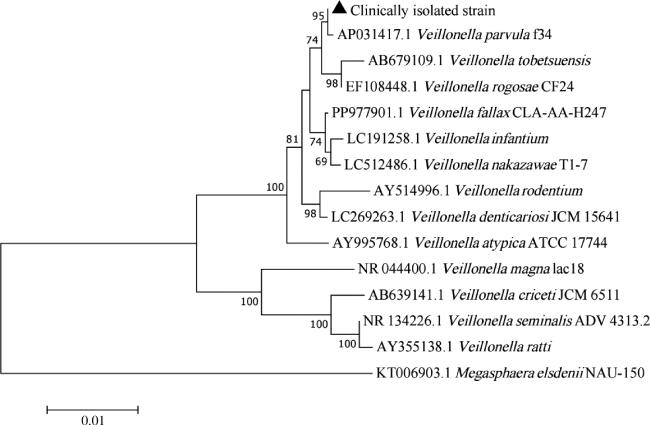
2.2 野生株V. parvula的生长曲线及乳酸代谢能力
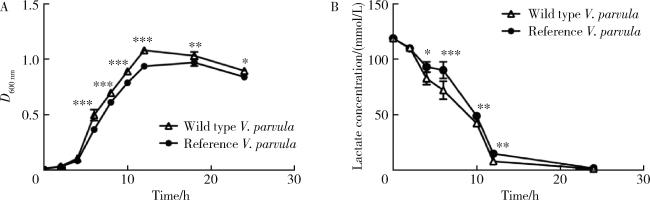
图3 野生株V. parvula与标准株V. parvula的生长曲线及培养基内乳酸浓度Figure 3 Comparison of growth curves and lactate concentration in broth between the wild type strain V. parvula and the reference strian V.parvula A, growth curves of the wild type strain V. parvula and the reference strian V.parvula; B, curve of lactate concentration during an observation period of 24 h. All data are presented as the mean±SD from at least three independent experiments. *P < 0.05, * *P < 0.01, * * *P < 0.001. |
2.3 细菌生物膜的形态结构
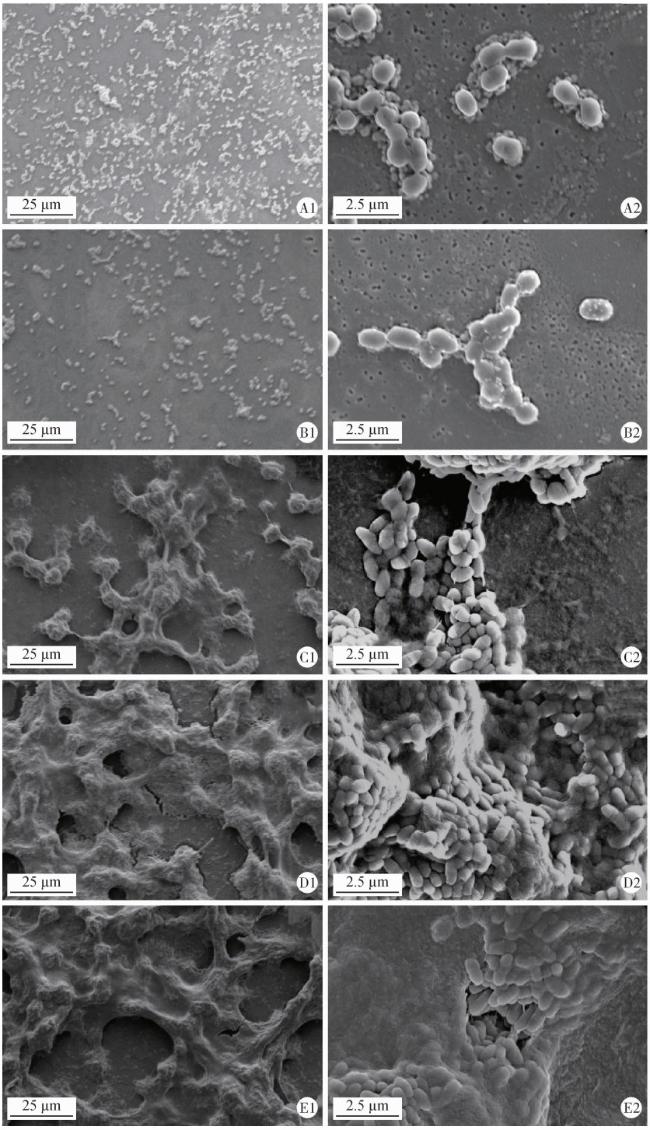
图4 扫描电镜下观察生物膜形态结构Figure 4 Representative scanning electron microscopy images of biofilms A, wild type strain V. parvula; B, reference strian V.parvula; C, S.mutans; D, wild type strain V. parvula+S.mutans; E, reference strian V.parvula+S.mutans. 1, magnification ×1 000; 2, magnification ×10 000. |
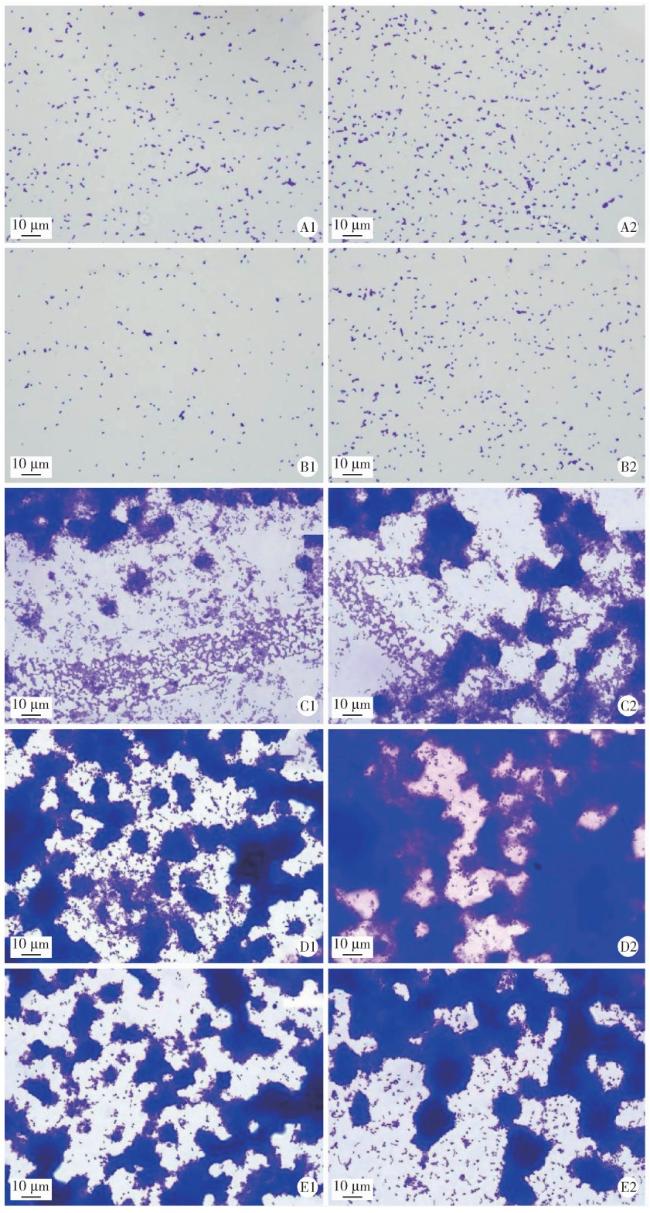
图5 光学显微镜下观察结晶紫染色结果(× 1 000)Figure 5 Representative crystal violet staining images of biofilms under optical microscope (×1 000) A, wild type strain V. parvula; B, reference strian V.parvula; C, S.mutans; D, wild type strain V. parvula+S.mutans; E, reference strian V.parvula+S.mutans. 1, 12 h; 2, 24 h. |
2.4 结晶紫染色半定量分析细菌生物膜量
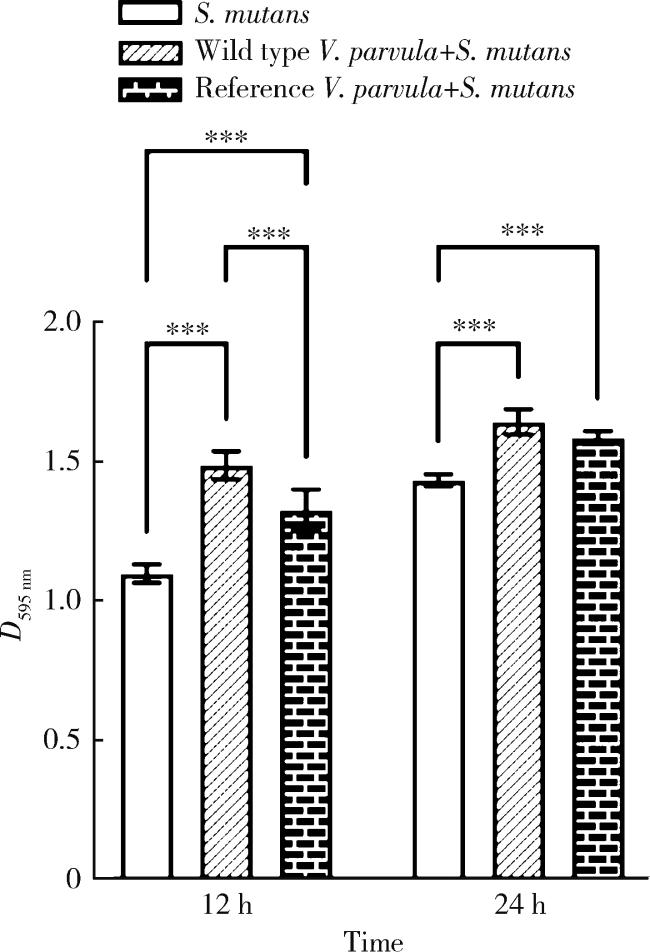
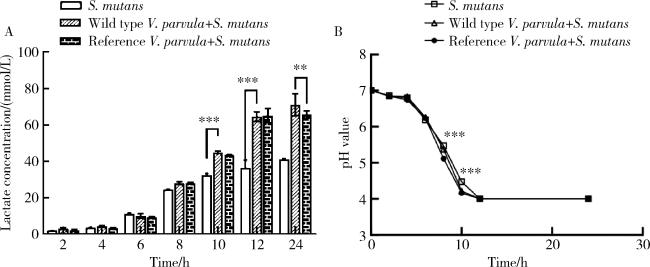


图7 V. parvula与S. mutans共培养组中乳酸积累量及pH值的变化Figure 7 Changes in lactate accumulation and pH values in a co-culture group of V. parvula and S. mutans A, lactate concentration of single-and dual-species biofilms; B, pH value of single-and dual-species biofilms. All data are presented as the mean±SD from at least three independent experiments. * *P < 0.01, * * *P < 0.001. |