
1 资料与方法
1.1 研究对象
1.2 暴露因素
1.3 结局事件
1.4 统计学分析
2 结果
2.1 队列人群的基线特征和结局事件
表1 研究对象的基线特征Table 1 Baseline characteristics of study participants |
| Characteristic | Total (n=226 406) | Women (n=120 558) | Men (n=105 848) | P value* |
| Age/years | 55.0±9.7 | 54.5±9.6 | 55.5±9.9 | < 0.001 |
| Education (senior high school or higher) | 34 173 (15.1) | 14 806 (12.3) | 40 238 (38.0) | < 0.001 |
| Region (Urban) | 154 444 (68.2) | 81 099 (67.3) | 73 345 (69.3) | < 0.001 |
| Current smoker | 41 861 (18.5) | 1 623 (1.3) | 40 238 (38.0) | < 0.001 |
| Diabetes | 19 701 (8.7) | 10 475 (8.7) | 9 226 (8.7) | 0.823 |
| Hypertension | 74 319 (32.8) | 39 305 (32.6) | 35 014 (33.1) | 0.016 |
| Treated hypertension | 69 047 (30.5) | 34 237 (28.4) | 348 100 (32.9) | < 0.001 |
| Family history of CVD | 1 486 (0.7) | 691 (0.6) | 795 (0.8) | < 0.001 |
| SBP/mmHg | 131.2±16.3 | 130.6±16.7 | 131.9±15.9 | < 0.001 |
| DBP/mmHg | 81.6±9.6 | 80.8±9.6 | 82.5±9.5 | < 0.001 |
| BMI/(kg/m2) | 23.3±2.8 | 23.2±2.9 | 23.3±2.7 | < 0.001 |
| FBG/(mg/dL) | 103.6±30.8 | 101.8±27.2 | 105.7±34.3 | < 0.001 |
| TG/(mg/dL) | 145.5 (111.5, 179.1) | 141.6 (106.4, 172.8) | 151.2 (116.4, 185.7) | < 0.001 |
| TC/(mg/dL) | 190.2±37.8 | 194.3±37.7 | 185.6±37.3 | 0.030 |
| HDL-C/(mg/dL) | 50.3±12.9 | 52.0±12.4 | 48.5±13.1 | < 0.001 |
| LDL-C/(mg/dL) | 109.7±31.0 | 111.5±31.3 | 107.2±30.6 | < 0.001 |
| TyG index | 8.7 (8.3, 9.1) | 8.7 (8.2, 9.0) | 8.8 (8.3, 9.1) | < 0.001 |
Data were ${\bar x}$±s,n(%) or M(P25, P75). *Compared between men and women. CVD, cardiovascular disease; SBP, systolic blood pressure; DBP, diastolic blood pressure; BMI, body mass index; FBG, fasting plasma glucose; TG, triglycerides; TC, total cholesterol; HDL-C, high-density lipoprotein cholesterol; LDL-C, low-density lipoprotein cholesterol; TyG index, triglyceride-glucose index. |
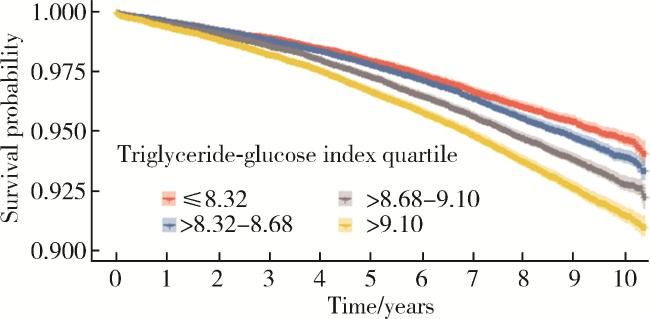
2.2 TyG指数与心血管病复合结局事件的关联
表2 甘油三酯-葡萄糖指数与心血管病发病和死亡的关联Table 2 Association of triglyceride-glucose index and cardiovascular disease events |
| Quartile | Number of cases | Case per 1 000 person-years | Model 1 | Model 2 | Model 3 | Model 4 | |||||||
| HR (95%CI) | P | HR (95%CI) | P | HR (95%CI) | P | HR (95%CI) | P | ||||||
| Quartile 1 (≤8.32) | 1 890 | 4.93 | Reference | Reference | Reference | Reference | |||||||
| Quartile 2 (>8.32-8.68) | 2 169 | 5.56 | 1.12 (1.05-1.19) | < 0.001 | 1.04 (0.98-1.10) | 0.244 | 1.02 (0.96-1.08) | 0.611 | 1.02 (0.96-1.08) | 0.611 | |||
| Quartile 3 (>8.68-9.10) | 2 621 | 6.67 | 1.34 (1.26-1.42) | < 0.001 | 1.19 (1.12-1.26) | < 0.001 | 1.15 (1.08-1.22) | < 0.001 | 1.15 (1.08-1.22) | < 0.001 | |||
| Quartile 4 (>9.10) | 3 135 | 8.00 | 1.61 (1.52-1.70) | < 0.001 | 1.50 (1.41-1.58) | < 0.001 | 1.42 (1.34-1.51) | < 0.001 | 1.42 (1.34-1.51) | < 0.001 | |||
HR, hazard ratio; CI, confidence interval. Model 1, unadjusted; Model 2, adjusted for age, gender; Model 3, adjusted for age, gender, education, region, smoking status, body mass index, systolic blood pressure; Model 4, adjusted for age, gender, education, region, smoking status, body mass index, systolic blood pressure, and total cholesterol. |
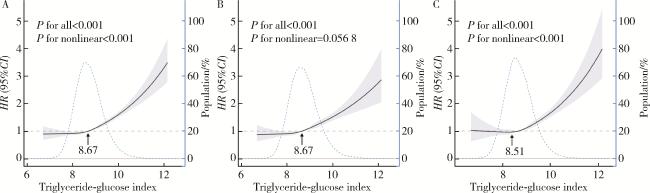
图2 按性别分组的甘油三酯-葡萄糖指数与心血管病发病和死亡的非线性关联Figure 2 Nonlinear association of triglyceride-glucose index and cardiovascular disease events, by gender A, overall; B, men; C, women. P for all tested whether using splines improves the model compared to a simple linear term; P for nonlinear tested whether the nonlinear part of the spline model is statistically significant; Graphs show multivariate adjusted hazard ratios (HR; solid lines) and 95%CI (shaded areas). Dashed lines represent the proportion of the population with different levels of triglyceride-glucose index. Arrows indicate the triglyceride-glucose index at the point where risk crosses the reference line (HR=1). |
