论著

慢性阻塞性肺疾病患者体力活动与死亡风险的前瞻性关联

  • 张烁 1 ,
  • 兰勇兵 1 ,
  • 孙点剑一 1, 2, 3 ,
  • 裴培 2 ,
  • 杜怀东 4 ,
  • 陈君石 5 ,
  • 陈铮鸣 4 ,
  • 吕筠 1, 2, 3, 6 ,
  • 李立明 1, 2, 3 ,
  • 余灿清 , 1, 2, 3, * ,
  • (代表中国慢性病前瞻性研究项目协作组)
展开
  • 1. 北京大学公共卫生学院流行病与卫生统计学系, 北京 100191
  • 2. 北京大学公众健康与重大疫情防 控战略研究中心, 北京 100191
  • 3. 重大疾病流行病学教育部重点实验室(北京大学), 北京 100191
  • 4. Clinical Trial Service Unit and Epidemiological Studies Unit, Nuffield Department of Population Health, University of Oxford, Oxford OX3 7LF, UK
  • 5. 国家食品安全风险评估中心, 北京 100022
  • 6. 北京大学血管稳态与重构全国重点实验室, 北京 100191

收稿日期: 2025-02-04

  网络出版日期: 2025-06-13

基金资助

四大慢病重大专项(2023ZD0510100)

国家自然科学基金(82192901)

国家自然科学基金(82192904)

国家自然科学基金(82192900)

国家自然科学基金(82388102)

英国Wellcome Trust(212946/Z/18/Z)

英国Wellcome Trust(202922/Z/16/Z)

英国Wellcome Trust(104085/Z/14/Z)

英国Wellcome Trust(088158/Z/09/Z)

香港Kadoorie Charitable基金

版权

版权所有,未经授权,不得转载。

Prospective association between physical activity and mortality in patients with chronic obstructive pulmonary disease

  • Shuo ZHANG 1 ,
  • Yongbing LAN 1 ,
  • Dianjianyi SUN 1, 2, 3 ,
  • Pei PEI 2 ,
  • Huaidong DU 4 ,
  • Junshi CHEN 5 ,
  • Zhengming CHEN 4 ,
  • Jun LV 1, 2, 3, 6 ,
  • Liming LI 1, 2, 3 ,
  • Canqing YU , 1, 2, 3, * ,
  • (for the China Kadoorie Biobank Collaborative Group)
Expand
  • 1. Department of Epidemiology & Biostatistics, Peking University School of Public Health, Beijing 100191, China
  • 2. Peking University Center for Public Health and Epidemic Preparedness & Response, Beijing 100191, China
  • 3. Key Laboratory of Epidemiology of Major Diseases (Peking University), Ministry of Education, Beijing 100191, China
  • 4. Clinical Trial Service Unit and Epidemiological Studies Unit, Nuffield Department of Population Health, University of Oxford, Oxford OX3 7LF, UK
  • 5. China National Center for Food Safety Risk Assessment, Beijing 100022, China
  • 6. State Key Laboratory of Vascular Homeostasis and Remodeling, Peking University, Beijing 100191, China
YU Canqing, e-mail,

Received date: 2025-02-04

  Online published: 2025-06-13

Supported by

the Noncommunicable Chronic Diseases-National Science and Technology Major Project(2023ZD0510100)

National Natural Science Foundation of China(82192901)

National Natural Science Foundation of China(82192904)

National Natural Science Foundation of China(82192900)

National Natural Science Foundation of China(82388102)

Wellcome grants to Oxford University(212946/Z/18/Z)

Wellcome grants to Oxford University(202922/Z/16/Z)

Wellcome grants to Oxford University(104085/Z/14/Z)

Wellcome grants to Oxford University(088158/Z/09/Z)

Kadoorie Charitable Foundation in Hong Kong

Copyright

All rights reserved. Unauthorized reproduction is prohibited.

摘要

目的: 探讨中国成人慢性阻塞性肺疾病(chronic obstructive pulmonary disease, COPD)患者体力活动水平与死亡风险的前瞻性关联。方法: 基于中国慢性病前瞻性研究(China Kadoorie Biobank, CKB)项目, 采用Cox比例风险回归模型分析中国成人COPD患者中总体力活动、不同强度(低、中高强度)及不同类型(工作、非工作)体力活动水平与全因死亡、主要死因死亡风险的前瞻性关联, 根据体力活动水平的五分位数分为5组(Q1~Q5), 将体力活动水平最低五分位数组(Q1)作为对照组, 计算其余各组(Q2~Q5)风险比(hazard ratio, HR)及其95%置信区间(confidence interval, CI), 同时实施了敏感性分析及亚组分析, 包括年龄、性别、自评健康状况、COPD严重程度等。结果: 基线时纳入33 588例COPD患者, 平均随访(11.1±3.1)年, 共记录到死亡8 314人(22.3%)。总体力活动水平与全因死亡、血管疾病及呼吸系统疾病死亡风险之间存在线性负相关(线性趋势检验P值依次为 < 0.001、0.002、 < 0.001), 与总体力活动水平最低五分位数组(Q1)相比, 最高五分位数组(Q5)对应的全因死亡、血管疾病及呼吸系统疾病死亡风险HR值(95%CI)分别为0.77 (0.70, 0.85)、0.77 (0.65, 0.91)、0.58 (0.48, 0.71)。低强度、中高强度体力活动均与COPD患者全因死亡风险存在线性负相关关联(线性趋势检验P值依次为0.002、 < 0.001), 与低强度、中高强度体力活动水平最低五分位数组(Q1)相比, 最高五分位数组(Q5)全因死亡风险对应的HR值(95%CI)分别为0.89 (0.82, 0.97)、0.79 (0.72, 0.87)。工作、非工作相关体力活动亦与COPD患者全因死亡风险存在线性负相关关联(线性趋势检验P值依次为 < 0.001、0.015), 与工作、非工作相关体力活动水平最低五分位数组(Q1)相比, 最高五分位数组(Q5)全因死亡风险对应的HR值(95%CI)分别为0.69 (0.61, 0.78), 0.91 (0.84, 0.98)。对于年龄≥60岁、女性、自评健康状况较差的人群, 总体力活动与全因死亡风险负相关性更为显著。对于不同严重程度的COPD患者, 随着总体力活动的增加, 全因死亡风险均呈下降趋势。结论: 总体力活动、不同强度、不同类别的体力活动均与COPD患者的死亡风险呈负相关, 且存在剂量反应关系。对于年龄≥60岁、女性、自评健康状况较差的人群, 总体力活动与全因死亡风险负相关性更为显著。

本文引用格式

张烁 , 兰勇兵 , 孙点剑一 , 裴培 , 杜怀东 , 陈君石 , 陈铮鸣 , 吕筠 , 李立明 , 余灿清 , (代表中国慢性病前瞻性研究项目协作组) . 慢性阻塞性肺疾病患者体力活动与死亡风险的前瞻性关联[J]. 北京大学学报(医学版), 2025 , 57(3) : 537 -544 . DOI: 10.19723/j.issn.1671-167X.2025.03.018

Abstract

Objective: To explore the prospective association between physical activity level and mortality risk in Chinese adults with chronic obstructive pulmonary disease (COPD). Methods: Based on the China Kadoorie Biobank (CKB) who had COPD at the baseline survey, this study employed the Cox proportional hazards regression model to estimate the prospective associations between the overall physical activity, different intensities (low-level, moderate-to-vigorous-level), and types (occupational, non-occupational) of physical activity level and the risks of all-cause and cause-specific mortality, such as vascular diseases, cancer, and respiratory diseases. Based on the quintiles of physical activity level, participants were divided into five groups (Q1-Q5), with the lowest quintile group (Q1) as the reference group. Hazard ratio (HR) and 95% confidence interval (95%CI) were calculated for the remaining. In our study, we also performed sensitivity and subgroup analyses, including age, gender, self-rated health status, severity of COPD, etc. Results: Among 33 588 COPD patients at the baseline survey, 8 314 (22.2%) deaths were documented during an average follow-up of (11.1±3.1) years. Negative linear associations between the overall physical activity level and mortality risk from all-cause, vascular, and respiratory diseases were observed (P trend for linear correlation being < 0.001, 0.002, < 0.001). Compared with the lowest quintile group of total physical activity (Q1), the hazard ratios (HR) and 95% confidence intervals (CI) for all-cause mortality, vascular disease mortality, and respiratory disease mortality in the highest quintile group (Q5) were 0.77 (0.70, 0.85), 0.77 (0.65, 0.91), and 0.58 (0.48, 0.71), respectively. The low-level and moderate-to-vigorous-level physical activity were negatively associated with all-cause mortality in the COPD patients (P trend for linear correlation: 0.002, < 0.001, respectively). Compared with the lowest quintile group of low-intensity and moderate-to-vigorous intensity physical activity (Q1), the HRs (95%CI) for all-cause mortality in the highest quintile group (Q5) were 0.89 (0.82, 0.97) and 0.79 (0.72, 0.87), respectively. The occupational and non-occupational physical activity were also found to have a linear inverse association with all-cause mortality risk among the COPD patients (P trend < 0.001 and 0.015, respectively). Compared with the lowest quintile group of occupational and non-occupational physical activity (Q1), the HR (95%CI) for all-cause mortality in the highest quintile group (Q5) were 0.69 (0.61, 0.78) and 0.91 (0.84, 0.98), respectively. The associations between overall physical activity and all-cause mortality risk were stronger for patients aged 60 and above, female, and who reported poor health status (P for interaction: 0.028, 0.012, 0.010). The protective effect of total physical activity was also applicable to the COPD patients of varying severity. Conclusion: Physical activity could reduce the mortality risk in a dose-response relationship among COPD patients, regardless of its intensity and type, especially among individuals aged 60 and above, females, and those with poor self-report health status.

慢性阻塞性肺疾病(chronic obstructive pulmo-nary disease,COPD)是一种常见、可预防和治疗的疾病,其特征是持续性气流受限和呼吸道症状[1],患病率高,是主要的致死、致残原因,且呈逐年上升趋势[2]。2012—2015年中国40岁以上人群COPD的患病率为13.7%[3],较10年前增加约67.1%[4],2019年中国COPD死亡人数居全球之最[5]。COPD严重影响患者的身心健康及生活质量,给患者家庭及社会带来沉重的负担[5],及时采取有效的预防措施控制COPD的发展十分重要。
规律的体力活动能使多种慢性疾病(包括COPD)患者获益[2, 6-7]。然而,目前关于COPD患者中体力活动与死亡风险的关联研究较少,研究方向主要集中在休闲相关体力活动及中高强度体力活动,且无体力活动水平的推荐,因此,有必要研究总体力活动、不同类型及不同强度的体力活动对COPD患者生存的影响及相关的剂量反应关系。本研究旨在探讨COPD患者中,总体力活动、不同强度及不同类型体力活动与全因死亡、主要死因死亡风险之间的前瞻性关联,并探讨剂量反应关系,为降低其死亡风险提供证据支持。

1 资料与方法

1.1 研究对象

中国慢性病前瞻性研究(China Kadoorie Biobank, CKB)项目根据各区域居民生活水平状况、人口流动性、相关疾病及危险因素的分布情况、开展调查及随访的难易程度及专业性等因素,最终选定我国10个地区(城市及农村地区各5个)进行调研。CKB项目基线调查开展于2004年6月至2008年7月,调查内容包括问卷调查、体格指标测量和血标本采集,由接受过统一培训的调查员进行。CKB项目获得英国牛津大学(批准号:025-04)和中国疾病预防控制中心伦理委员会审查批准(批准号:005/2004),所有研究对象参与调查前签署了知情同意书。有关CKB项目详细的研究设计和样本特征参见文献[8-9]。
本研究以CKB项目基线调查招募的512 724例研究对象为基础,纳入基线调查中37 057例临床诊断COPD或经肺功能筛查符合COPD诊断标准[2]的患者作为研究对象,依次排除未报告任何体力活动者780例,无工作却报告工作相关交通活动者142例,体力活动和静坐累计时间20 h以上者48例,第一秒用力呼气容积(forced expiratory volume in one second, FEV1)/用力肺活量(forced vital capacity, FVC)>1的参与者10例,基线自报患有哮喘1 191例、恶性肿瘤192例、类风湿关节炎1 018例、风湿性心脏病88例的患者,共计纳入33 588例COPD患者。

1.2 研究方法

基线调查问卷收集了研究对象在过去1年内体力活动情况。问卷详细询问了参与者体力活动类型(工作、交通、家务、休闲)、从事该类体力活动的频率(从无、非每周、每周1~2天、每周3~5天、每天)及累计时间。本研究中个体体力活动水平以体力活动总量表示,查找2011年更新的《体力活动概要》[10]可获取各类型体力活动的代谢当量(metabo-lic equivalent,MET),从而计算体力活动容量,即等于个体参与该项体力活动的MET×持续时间×活动频率,通常表示为MET-hours/day,将相关体力活动容量相加即可获得该项体力活动水平。关于体力活动问卷的详细信息可参阅文献[11]。本研究计算个体2种不同类型(工作、非工作)、2种不同强度(低强度: < 3.0 METs、中高强度:≥3.0 METs)及总体力活动水平。根据体力活动水平的五分位数分为5组(Q1~Q5)。
相关协变量信息通过基线调查问卷获得,主要包括:研究对象的基本特征(性别、年龄、地区、受教育程度、婚姻状态、家庭年收入、职业);生活方式特征(吸烟、饮酒、膳食、休闲静坐时间);COPD严重程度;自评健康状况;基线疾病史(冠心病、糖尿病、肾脏疾病、卒中);体格检查指标(身高、体重、肺功能),其中,COPD严重程度指根据慢性阻塞性肺疾病全球倡议(Global Initiative for Chronic Obstructive Lung Disease,GOLD)分为GOLD 1~4级[2]。体格检查指标由经过培训的调查员使用标准仪器测得。进一步计算体重指数(body mass index,BMI)=体重(kg)/身高2(m2),并根据BMI水平进行分组: < 18.5、18.5~、24.0~、≥28.0 kg/m2,分别为低体重、正常体重、超重、肥胖[12]
本研究的跨度从研究对象完成基线调查之日起,至出现死亡、失访或到2018年12月31日止。发病和死亡信息通过多途径获取,包括当地的死亡和常规疾病监测系统、全民医疗保险数据库以及主动的定向监测。发病或死因分类采用国际疾病分类(International Classification Of Diseases,ICD)第十版,即ICD-10。根据入组患者的死因排序,除全因死亡外,分析体力活动水平与排名前三位的死因结局相关性,排名前三位的死因结局主要包括血管疾病死亡(ICD-10: I00-I99)、恶性肿瘤死亡(ICD-10: C00-C97)及呼吸系统疾病死亡(ICD-10: J00-J99)。

1.3 统计学分析

在描述总体力活动不同水平分组下研究对象的基线特征时采用线性回归(连续变量)、Logistic回归(二分类变量)或Kruskal-Wallis检验(等级资料),报告调整年龄、性别和地区后的均数±标准差或构成比。本研究采用Schoenfeld残差法检验是否满足比例风险(proportional hazards, PH)假设,在满足PH假设前提下(P>0.05),使用Cox比例风险回归模型评价COPD患者中总体力活动水平、不同强度及不同类型体力活动水平与全因死亡、血管疾病死亡、恶性肿瘤死亡及呼吸系统疾病死亡风险间的关联,计算风险比(hazard ratio, HR)和95% 置信区间(confidence interval, CI)。模型以年龄为时间尺度,年龄按5岁一组分层,项目区域按10个地区分层,逐步调整已知或潜在的混杂因素。模型1调整性别及基线社会人口特征:受教育程度、婚姻状态、家庭年收入、职业;模型2在模型1的基础上进一步调整生活方式及其他变量:吸烟状况,饮酒状况,膳食(红肉、新鲜蔬菜和新鲜水果摄入频率),休闲静坐时间,BMI,基线自评健康状况,COPD严重程度(GOLD分级)[2],现患冠心病、糖尿病、肾脏疾病及卒中。此外,在分析不同类型/强度体力活动水平与COPD患者死亡风险的关联时,对其他类型/强度体力活动水平进行调整。本研究敏感性分析策略包括:排除前两年死亡的个体,排除基线患有慢性病的个体(冠心病、糖尿病、肾脏疾病、卒中/短暂性脑缺血发作),剔除COPD病程>30年的患者。本研究以模型2为基础进行亚组分析,采用似然比检验,比较有交互项模型和无交互项模型的差异以探讨交互作用。因为GOLD4级患者较少,在进行亚组分析时,将GOLD3级及GOLD4级患者合并成一组进行分析。
本研究使用Stata 15.0软件进行分析,双侧检验,检验水准α=0.05。

2 结果

2.1 一般情况

共纳入33 588例COPD患者,平均随访(11.1± 3.1)年,年龄均值为(58.2±10.7)岁,男性占49.6%,城市人口占36.4%。高水平体力活动者较年轻、居住在乡村地区、从事工农业生产,其休闲静坐时间及BMI水平较低,基线现患慢性疾病比例也较低(表 1)。
表1 COPD患者的基线特征分布

Table 1 Baseline characteristics of COPD participants by level of total physical activity

Characteristic Quintiles of total physical activity F/χ2 P
Q1 (n=6 774) Q2 (n=6 668) Q3 (n=6 731) Q4 (n=6 698) Q5 (n=6 717)
Age/years,${\bar x}$±s 64.4±8.8 61.6±9.7 58.1±10.5 55.0±10.3 52.0±9.5 1 746.7 < 0.001
Gender, n (%) 1 155.9 < 0.001
  Female 2 405 (35.5) 4 174 (62.6) 3 655 (54.3) 3 697 (55.2) 3 009 (44.8)
  Male 4 369 (64.5) 2 494 (37.4) 3 076 (45.7) 3 001 (44.8) 3 708 (55.2)
Area, n (%) 538.2 < 0.001
  Urban 3 069 (45.3) 2 714 (40.7) 2 275 (33.8) 1 842 (27.5) 2 317 (34.5)
  Rural 3 705 (54.7) 3 954 (59.3) 4 456 (66.2) 4 856 (72.5) 4 400 (65.5)
Married, n (%) 19.44 0.001
  Married 5 731 (84.6) 5 661 (84.9) 5 829 (86.6) 5 800 (86.6) 5 803 (86.4)
  Other 1 043 (15.4) 1 007 (15.1) 902 (13.4) 898 (13.4) 914 (13.6)
Education, n (%) 86.72 < 0.001
  Middle school and higher 2 249 (33.2) 2 174 (32.6) 2 214 (32.9) 2 043 (30.5) 1 840 (27.4)
  Primary school and lower 4 525 (66.8) 4 494 (67.4) 4 517 (67.1) 4 655 (69.5) 4 877 (72.6)
Household income, n (%) 55.75 < 0.001
  ≥20 000 yuan/year 2 113 (31.2) 2 274 (34.1) 2 430 (36.1) 2 197 (32.8) 2 230 (33.2)
   < 20 000 yuan/year 4 661 (68.8) 4 394 (65.9) 4 301 (63.9) 4 501 (67.2) 4 487 (66.8)
Occupation, n (%) 3 949.37 < 0.001
  Agriculture and industrial 2 174 (32.1) 2 634 (39.5) 4 146 (61.6) 4 930 (73.6) 5 145 (76.6)
  Other occupation 4 600 (67.9) 4 034 (60.5) 2 585 (38.4) 1 768 (26.4) 1 572 (23.4)
Regular consumption of meat, n (%) 31.86 < 0.001
  ≥4 d/week 2 757 (40.7) 2 674 (40.1) 2 612 (38.8) 2 451 (36.6) 2 646 (39.4)
   < 4 d/week 4 017 (59.3) 3 994 (59.9) 4 119 (61.2) 4 247 (63.4) 4 071 (60.6)
Regular consumption of fresh vegetables, n (%) 12.81 0.012
  ≥4 d/week 6 672 (98.5) 6 588 (98.8) 6 643 (98.7) 6 571 (98.1) 6 616 (98.5)
   < 4 d/week 102 (1.5) 80 (1.2) 88 (1.3) 127 (1.9) 101 (1.5)
Regular consumption of fresh fruit, n (%) 104.56 < 0.001
  ≥4 d/week 1 531 (22.6) 1 607 (24.1) 1 602 (23.8) 1 326 (19.8) 1 209 (18.0)
   < 4 d/week 5 243 (77.4) 5 061 (75.9) 5 129 (76.2) 5 372 (80.2) 5 508 (82.0)
Drinking status, n (%) 52.19 < 0.001
  Current weekly drinker 2 683 (39.6) 2 627 (39.4) 2 706 (40.2) 2 693 (40.2) 2 821 (42.0)
  Non-current weekly drinker 4 091 (60.4) 4 041 (60.6) 4 025 (59.8) 4 005 (59.8) 3 896 (58.0)
Smoking status, n (%) 18.58 0.001
  Current daily smoker 1 009 (14.9) 1 014 (15.2) 1 198 (17.8) 1 192 (17.8) 1 243 (18.5)
  Non-current smoker 5 765 (85.1) 5 654 (84.8) 5 533 (82.2) 5 506 (82.2) 5 474 (81.5)
BMI/(kg/m2),${\bar x}$±s 22.8±3.8 22.8±3.7 22.8±3.5 22.5±3.4 22.5±3.2 10.65 < 0.001
Sedentary/ (h/d),${\bar x}$±s 3.5±2.0 3.5±1.8 3.1±1.6 2.7±1.5 2.5±1.4 390.75 < 0.001
GOLD, n (%) 456.27 < 0.001
  1 1 687 (24.9) 1 840 (27.6) 2 006 (29.8) 1 942 (29.0) 2 042 (30.4)
  2 3 184 (47.0) 3 194 (47.9) 3 150 (46.8) 3 275 (48.9) 3 379 (50.3)
  3 1 429 (21.1) 1 300 (19.5) 1 292 (19.2) 1 233 (18.4) 1 101 (16.4)
  4 474 (7.0) 334 (5.0) 283 (4.2) 248 (3.7) 195 (2.9)
Self-assessed health status, n (%) 362.41 < 0.001
  Excellent 644 (9.5) 785 (11.8) 828 (12.3) 824 (12.3) 804 (11.9)
  Good 1 361 (20.1) 1 426 (21.4) 1 615 (24.0) 1 567 (23.4) 1 798 (26.8)
  Average 2 994 (44.2) 3 065 (45.9) 3 110 (46.2) 3 182 (47.5) 3 054 (45.5)
  Poor 1 775 (26.2) 1 392 (20.9) 1 178 (17.5) 1 125 (16.8) 1 061 (15.8)
Coronary heart disease, n (%) 46.98 < 0.001
  Yes 318 (4.7) 280 (4.2) 269 (4.0) 174 (2.6) 154 (2.3)
  No 6 456 (95.3) 6 388 (95.8) 6 462 (96.0) 6 524 (97.4) 6 563 (97.7)
Diabetes, n (%) 62.14 < 0.001
  Yes 271 (4.0) 240 (3.6) 168 (2.5) 147 (2.2) 114 (1.7)
  No 6 503 (96.0) 6 428 (96.4) 6 563 (97.5) 6 551 (97.8) 6 603 (98.3)
Kidney disease, n (%) 14.35 0.006
  Yes 163 (2.4) 120 (1.8) 108 (1.6) 127 (1.9) 101 (1.5)
  No 6 611 (97.6) 6 548 (98.2) 6 623 (98.4) 6 571 (98.1) 6 616 (98.5)
Stroke, n (%) 101.74 < 0.001
  Yes 217 (3.2) 133 (2.0) 94 (1.4) 60 (0.9) 60 (0.9)
  No 6 557 (96.8) 6 535 (98.0) 6 637 (98.6) 6 638 (99.1) 6 657 (99.1)

Total physical activity was divided into 5 parts according to quintiles, and the boundaries are 0.2-, 8.0-, 12.2-, 19.1-, 30.3-108.2 MET-hours/day; Results were standardized by age, sex, and region (where appropriate). COPD, chronic obstructive pulmonary disease; BMI, body mass index; GOLD, Global Initiative for Chronic Obstructive Lung Disease; MET, metabolic equivalent of the task.

2.2 总体力活动与死亡风险的关联

截止至2018年12月31日,累计死亡8 314例(22.3%),排名前三位的死因分别为血管疾病(2 940例,7.9%)、恶性肿瘤(2 086例,5.6%)及呼吸系统疾病(2 075例,5.6%)。总体力活动水平与全因死亡、血管疾病死亡及呼吸系统疾病死亡呈负相关,其相关呈线性趋势(P值依次为 < 0.001、0.002、 < 0.001),与恶性肿瘤死亡无明显相关性。与总体力活动水平最低五分位数组(Q1)相比,总体力活动水平最高五分位数组(Q5)全因死亡、血管疾病死亡及呼吸系统疾病死亡风险的HR值(95%CI)分别为0.77 (0.70, 0.85)、0.77 (0.65, 0.91)、0.58 (0.48, 0.71,表 2)。对总体力活动水平与死亡风险的关联进行的三项敏感分析结果均未发生明显的变化。
表2 COPD患者中总体力活动与死亡风险的关联

Table 2 Associations of total physical activity with mortality risk in COPD patients

Quintiles of total physical activity P
Q1 Q2 Q3 Q4 Q5
All-cause mortality
  Number of deaths, n 2 764 1 955 1 558 1 195 842
  Mortality rate/% 40.4 26.8 20.5 15.5 10.6
  Model 1, HR(95%CI) 1.00 0.83 (0.78, 0.88) 0.76 (0.70, 0.81) 0.69 (0.63, 0.74) 0.63 (0.58, 0.69) < 0.001
  Model 2, HR(95%CI) 1.00 0.90 (0.84, 0.95) 0.85 (0.79, 0.91) 0.78 (0.72, 0.85) 0.77 (0.70, 0.85) < 0.001
Vascular disease mortality
  Number of deaths, n 1 069 749 506 372 244
  Mortality rate/% 15.6 10.3 6.7 4.8 3.1
  Model 1, HR(95%CI) 1.00 0.81 (0.74, 0.89) 0.75 (0.66, 0.84) 0.73 (0.63, 0.84) 0.66 (0.56, 0.77) < 0.001
  Model 2, HR(95%CI) 1.00 0.88 (0.80, 0.97) 0.83 (0.73, 0.93) 0.82 (0.71, 0.94) 0.77 (0.65, 0.91) 0.002
Malignant tumor mortality
  Number of deaths, n 619 470 383 327 287
  Mortality rate/% 9.1 6.4 5.1 4.2 3.6
  Model 1, HR(95%CI) 1.00 1.01 (0.90, 1.15) 0.91 (0.79, 1.05) 0.88 (0.75, 1.03) 0.88 (0.74, 1.04) 0.105
  Model 2, HR(95%CI) 1.00 1.03 (0.91, 1.16) 0.94 (0.82, 1.09) 0.91 (0.77, 1.08) 0.92 (0.78, 1.10) 0.293
Respiratory disease mortality
  Number of deaths, n 702 493 427 288 165
  Mortality rate/% 10.3 6.8 5.6 3.7 2.1
  Model 1, HR(95%CI) 1.00 0.74 (0.66, 0.83) 0.61 (0.53, 0.70) 0.45 (0.38, 0.53) 0.37 (0.31, 0.46) < 0.001
  Model 2, HR(95%CI) 1.00 0.86 (0.76, 0.97) 0.76 (0.66, 0.87) 0.58 (0.49, 0.69) 0.58 (0.48, 0.71) < 0.001

Total physical activity was divided into 5 parts according to quintiles, and the boundaries are 0.2-, 8.0-, 12.2-, 19.1-, 30.3-108.2 MET-hours/day; Model 1 was adjusted for education levels, income levels, occupation categories and marriage status; Model 2 was additionally adjusted for smoking, alcohol intake, dietary habits (frequency of meat, fresh vegetable, and fruit consumption), sedentary time(hours/day), BMI, self-assessed health status, GOLD levels, coronary heart disease, diabetes, kidney disease, stroke; The denominator of the mortality rate was 1 000 person-years. COPD, chronic obstructive pulmonary disease; MET, metabolic equivalent of the task; BMI, body mass index; GOLD, Global Initiative for Chronic Obstructive Lung Disease.

亚组分析显示:年龄、性别、饮酒状态、GOLD分级、BMI水平及自评健康状况和体力活动与COPD患者全因死亡风险存在交互作用(表 3)。对于年龄≥60岁、女性、自评健康状况较差的人群,总体力活动与全因死亡风险负相关性更为显著,相对于体力活动最低五分位数组(Q1),体力活动最高五分位数组(Q5)的HR值(95%CI)分别为:0.77 (0.68, 0.86)、0.64 (0.53, 0.76)、0.58 (0.48, 0.71)。对于不同GOLD分级的COPD患者,随着总体力活动的增加,全因死亡风险均呈下降趋势,相对于体力活动最低五分位数组(Q1),体力活动最高五分位数组(Q5)的HR值(95%CI)分别为为0.76 (0.60, 0.97)、0.87 (0.76, 1.00)、0.64 (0.55, 0.75)。
表3 COPD患者中总体力活动与全因死亡风险的亚组分析

Table 3 Subgroup analysis for the associations of total physical activity with all-cause mortality risk in COPD patients

Quintiles of total physical activity P(LR χ2)
Q1 Q2 Q3 Q4 Q5
Age group/years 0.028 (7.12)
  30- 1.00 1.19 (0.76, 1.86) 1.06 (0.68, 1.65) 1.02 (0.66, 1.59) 1.15 (0.75, 1.77)
  50- 1.00 0.88 (0.73, 1.06) 0.86 (0.71, 1.04) 0.81 (0.67, 0.99) 0.81 (0.66, 0.99)
  60- 1.00 0.90 (0.84, 0.96) 0.85 (0.79, 0.92) 0.79 (0.72, 0.87) 0.77 (0.68, 0.86)
Area 0.125 (2.35)
  Rural 1.00 0.89 (0.83, 0.96) 0.85 (0.78, 0.92) 0.79 (0.72, 0.86) 0.75 (0.68, 0.83)
  Urban 1.00 0.93 (0.84, 1.04) 0.88 (0.77, 1.01) 0.80 (0.65, 0.97) 0.86 (0.70, 1.06)
Gender 0.012 (6.24)
  Male 1.00 0.90 (0.83, 0.97) 0.90 (0.82, 0.98) 0.83 (0.75, 0.92) 0.81 (0.73, 0.91)
  Female 1.00 0.86 (0.78, 0.95) 0.77 (0.68, 0.87) 0.67 (0.58, 0.77) 0.64 (0.53, 0.76)
Smoking status 0.109 (2.57)
  Non-current smoker 1.00 0.91 (0.83, 0.99) 0.82 (0.74, 0.92) 0.76 (0.67, 0.86) 0.71 (0.61, 0.82)
  Current daily smoker 1.00 0.88 (0.81, 0.96) 0.86 (0.78, 0.95) 0.79 (0.71, 0.88) 0.79 (0.70, 0.89)
Drinking status 0.004 (8.12)
  Non-current weekly drinker 1.00 0.92 (0.86, 0.98) 0.86 (0.80, 0.93) 0.78 (0.71, 0.85) 0.77 (0.69, 0.86)
  Current weekly drinker 1.00 0.74 (0.62, 0.87) 0.75 (0.63, 0.89) 0.74 (0.61, 0.89) 0.71 (0.58, 0.87)
Sedentary/(h/d) 0.158 (1.99)
   < 3 1.00 0.91 (0.82, 1.00) 0.83 (0.75, 0.93) 0.78 (0.68, 0.88) 0.75 (0.66, 0.86)
  ≥3 1.00 0.88 (0.81, 0.95) 0.85 (0.77, 0.93) 0.78 (0.70, 0.87) 0.78 (0.68, 0.89)
GOLD 0.016 (8.32)
  1 1.00 0.92 (0.78, 1.09) 0.84 (0.69, 1.03) 0.76 (0.60, 0.95) 0.76 (0.60, 0.97)
  2 1.00 0.95 (0.87, 1.04) 0.95 (0.85, 1.06) 0.91 (0.81, 1.04) 0.87 (0.76, 1.00)
  3-4 1.00 0.82 (0.75, 0.90) 0.74 (0.66, 0.82) 0.66 (0.58, 0.74) 0.64 (0.55, 0.75)
BMI/(kg/m2) 0.003 (14.30)
  Underweight 1.00 0.86 (0.75, 0.99) 0.78 (0.66, 0.92) 0.64 (0.53, 0.78) 0.57 (0.45, 0.71)
  Normal weight 1.00 0.88 (0.81, 0.95) 0.80 (0.73, 0.89) 0.73 (0.65, 0.81) 0.71 (0.63, 0.80)
  Overweight 1.00 0.86 (0.75, 0.98) 0.81 (0.69, 0.96) 0.91 (0.75, 1.11) 0.77 (0.61, 0.96)
  Obese 1.00 1.02 (0.78, 1.33) 1.08 (0.81, 1.44) 0.60 (0.39, 0.91) 0.80 (0.49, 1.32)
Self-assessed health status 0.010 (11.34)
  Excellent 1.00 0.99 (0.78, 1.24) 0.91 (0.69, 1.20) 0.90 (0.65, 1.23) 0.95 (0.68, 1.33)
  Good 1.00 0.87 (0.75, 1.02) 0.82 (0.69, 0.98) 0.78 (0.64, 0.95) 0.70 (0.57, 0.86)
  Average 1.00 0.87 (0.80, 0.95) 0.87 (0.78, 0.96) 0.78 (0.69, 0.88) 0.73 (0.63, 0.84)
  Poor 1.00 0.85 (0.76, 0.95) 0.71 (0.62, 0.81) 0.61 (0.53, 0.71) 0.58 (0.48, 0.71)

Total physical activity was divided into 5 parts according to quintiles, and the boundaries are 0.2-, 8.0-, 12.2-, 19.1-, 30.3-108.2 MET-hours/day; Results are presented as HR (95%CI) and based on model 2; P values for interaction were calculated by likelihood ratio test, comparing models with and without cross-product terms between the stratification variables and total physical activity;Given the small number of participants with GOLD level 4, the GOLD 3 and GOLD 4 were combined into one group for the subgroup analysis. COPD, chronic obstructive pulmonary disease; GOLD, Global Initiative for Chronic Obstructive Lung Disease; BMI, body mass index; MET, metabolic equivalent of the task.

2.3 不同强度体力活动与死亡风险的关联
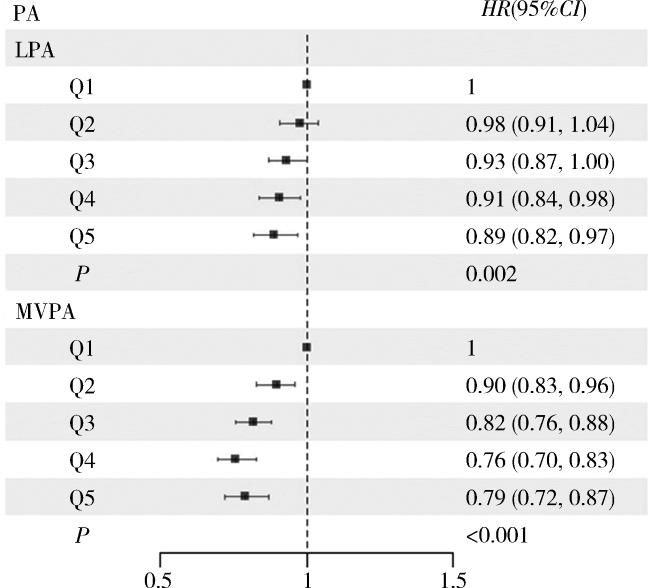
低强度、中高强度体力活动均与COPD患者全因死亡呈线性负相关(图 1P值依次为0.002、 < 0.001)。与低强度体力活动最低五分位数组(Q1)相比,其最高五分位数组(Q5)全因死亡风险的HR 值(95%CI)为0.89 (0.82, 0.97);与中高度体力活动最低五分位数组相比,其最高五分位数组全因死亡风险的HR值(95%CI)为0.79 (0.72, 0.87)。
图1 COPD患者不同强度体力活动与全因死亡风险的关联

Figure 1 Associations between different intensities of physical activity and all-cause mortality risk in COPD patients

LPA was divided into 5 parts according to quintiles, and the boundaries are 0-, 2.8-, 6.0-, 8.6-, 12.9-42.67 MET-hours/day; MVPA was divided into 5 parts according to quintiles, and the boundaries are 0-, 0.1-, 2.9-, 6.6-, 21.1-101.9 MET-hours/day; results are presented as HR (95%CI) and based on model 2. PA, physical activity; LPA low-level physical activity; MVPA moderate-to-vigorous-level physical activity; MET, metabolic equivalent of the task; COPD, chronic obstructive pulmonary disease.

2.4 不同类型体力活动与死亡风险的关联
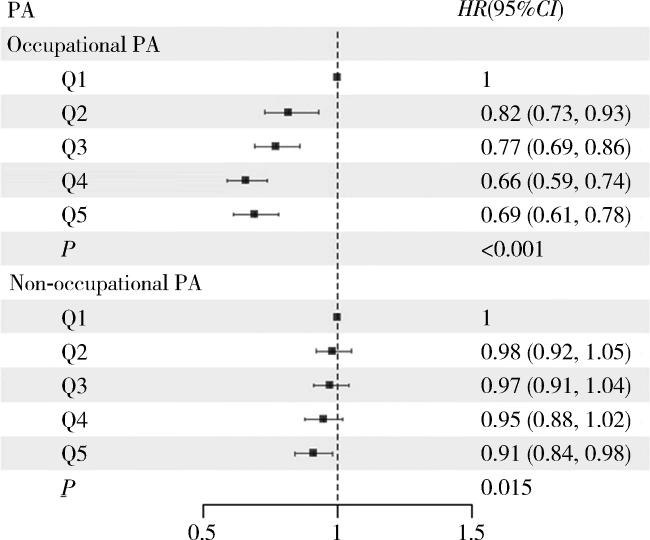
随着工作、非工作相关体力活动水平的增加,COPD患者全因死亡风险均呈线性下降趋势(图 2P值依次为 < 0.001、0.015)。与工作相关体力活动最低五分位数组(Q1)相比,其最高五分位数组(Q5)全因死亡风险的HR值(95%CI)为0.69 (0.61, 0.78);与非工作相关体力活动最低五分位数组(Q1)相比,其最高五分位数组(Q5)全因死亡风险的HR值(95%CI)为0.91 (0.84, 0.98)。
图2 COPD患者不同类型体力活动与全因死亡风险的关联

Figure 2 Associations between different types of physical activity and all-cause mortality risk in COPD patients

Occupational PA was divided into 5 parts according to quintiles, and the boundaries are 0-, 0.3-, 2.3-, 10.7-, 21.7-100 MET-hours/day; Non-occupational PA was divided into 5 parts according to quintiles, and the boundaries are 0-, 3.7-, 6.2-, 8.4-, 11.2-58.97 MET-hours/day; results are presented as HR (95%CI) and based on model 2. PA physical activity; MET, metabolic equivalent of the task; COPD, chronic obstructive pulmonary disease.

3 讨论

本研究在大规模COPD患者中进行前瞻性研究发现,总体力活动、不同强度及类型体力活动水平与全因死亡风险负相关,且存在剂量反应关系。该负相关关系适用于不同GOLD分级的COPD患者,且在年龄≥60岁、女性、自评健康状况较差的COPD患者中关联更为显著。
既往关于总体力活动与COPD患者死亡风险关联的研究较少,但结果基本与本研究一致。Cheng等[13]对2 398例欧洲COPD患者分析发现总体力活动水平与全因死亡、呼吸系统及心血管系统疾病死亡呈负相关,且存在剂量反应关系。孙明希等[14]对我国台湾美兆健康管理中心437 408例体检者进行分析发现,运动强度越大,COPD共病患者相对死亡风险下降越显著。采用多传感器臂带[15]、加速度计[16]等客观测量体力活动水平的研究也发现,COPD患者体力活动水平与全因死亡之间存在负相关的线性关系。
关于体力活动强度与COPD患者死亡风险的研究主要关注中高强度体力活动,缺乏低强度体力活动的研究证据。Kim等[17]发现诊断COPD后才开始进行中高强度体力活动也能降低死亡风险。Cheng等[13]发现随着中高强度体力活动水平的升高,全因死亡风险下降,但只有运动充足组(达到WHO推荐的标准),才能降低心血管及呼吸系统疾病的死亡风险。Moy等[18]对2 370例因COPD住院的患者进行追踪发现,与没有中高强度体力活动的患者相比,中高强度体力活动时间 < 150 min/周及≥150 min/周的患者全因死亡风险分别下降了28.0%(HR=0.72,95%CI:0.54, 0.97)及47.0%(HR=0.53, 95%CI:0.34, 0.84)。本研究结果与既往研究[13, 17-18]一致,并进一步发现中高强度体力活动与COPD患者死亡风险关联的线性趋势,体力活动最高组(在WHO推荐标准以上)将获得更高的健康受益(图 1)。此外,本研究亦分析了低强度体力活动与COPD患者死亡风险的关联,结果显示两者之间的关联亦呈线性负相关趋势(P=0.002)。本研究提示COPD患者可以根据自身条件选择不同强度体力活动以减少死亡风险,对于不能耐受中高强度体力活动的患者,也鼓励选择低强度体力活动进行锻炼。
此外,本研究还分析了工作、非工作相关体力活动与全因死亡风险的关联。既往研究主要关注休闲相关体力活动与COPD患者死亡风险之间的关联,且结论并不一致。Yuan等[19]发现充足的休闲相关体力活动(≥150 min/周)能降低COPD患者全因死亡风险。Kontro等[20]发现耐力训练、混合运动及力量运动均能降低死亡风险。Loprinzi等[21]发现每周两次力量运动能降低COPD患者全因死亡风险,未发现耐力运动的保护作用。我国人群日常体力活动多以工作相关活动为主[11],本研究发现工作相关体力活动与COPD患者死亡风险降低有一定相关性。
关于体力活动降低COPD患者死亡风险的机制尚不明确[22]。COPD患者体内存在各种炎症因子的异常[23],运动能通过多种途径调节各种炎症因子水平[24-25],产生抗炎现象,改善肺功能[25]。此外,运动期间肺血流压力和流量的波动对肺组织和血管施加的机械应变,可能会潜在地逆转间充质细胞衰老、恢复肺泡-毛细血管储备、改善COPD患者的通气功能[26],从而降低COPD患者的死亡风险。
本研究覆盖面广、样本量大、随访时间长,应尽可能控制已知的混杂因素。与既往研究[13, 17-21]主要关注休闲相关体力活动及中高强度体力活动不同,本研究补充了总体力活动、不同类型、不同强度体力活动的证据,且探讨了剂量反应关系,但本研究也存在一定的局限性:第一,本研究有关体力活动及相关协变量信息通过研究对象自报获得,可能存在信息偏倚;第二,本研究仅使用基线调查的体力活动水平进行分组,但个体的生活方式在随访的过程中可能出现变化,也有研究显示,该人群在随访过程中体力活动变化不明显[27];第三,本研究尽可能控制了潜在混杂因素,但未考虑其他COPD的影响因素,如职业暴露、室外空气污染等,不排除残余混杂的影响;第四,本研究以我国10个地区成人COPD患者作为研究对象,不能代表全国的情况,可能存在选择偏倚,研究结果不能直接外推到全国。随着穿戴设备和重复测量的深入,未来可探索客观测量体力活动水平、体力活动变化情况等与COPD患者死亡风险的关联。
综上所述,总体力活动、不同强度、不同类别的体力活动均对COPD患者的死亡风险产生保护作用。随着运动水平的提升,这种保护作用愈发显著。此外,对于年龄≥60岁、女性以及自评健康状况较差的COPD患者,体力活动的保护作用更为突出。本研究提示,COPD患者可以结合自身情况,积极参与不同强度、不同类型体力活动,以促进健康,减少死亡风险。

利益冲突  所有作者均声明不存在利益冲突。

作者贡献声明  张烁:提出研究设计思路,分析数据,撰写论文;兰勇兵:复核分析数据;孙点剑一、裴培、杜怀东:收集、整理数据;陈君石、陈铮鸣、吕筠:审定论文;李立明:负责中国慢性病前瞻性研究项目,总体把关和审定论文;余灿清:指导研究设计,修改论文,审定论文。

感谢所有参加CKB项目的队列成员和各项目地区的现场调查队调查员, 感谢项目管理委员会、国家项目办公室、牛津国际合作中心和10个项目地区办公室的工作人员。

1
慢性阻塞性肺疾病急性加重诊治专家组. 慢性阻塞性肺疾病急性加重诊治中国专家共识[J]. 国际呼吸杂志, 2023, 43 (2): 132- 149.

2
Global Initiative for Chronic Obstructive Lung Disease (GOLD). Global strategy for the diagnosis, management, and prevention of chronic obstructive pulmonary disease: 2025 update[EB/OL]. (2025-01-01)[2025-01-15]. https://www.goldcopd.org.

3
Wang C , Xu J , Yang L , et al. Prevalence and risk factors of chronic obstructive pulmonary disease in China (the China Pulmonary Health [CPH] study): A national cross-sectional study[J]. Lancet, 2018, 391 (10131): 1706- 1717.

DOI

4
Zhong N , Wang C , Yao W , et al. Prevalence of chronic obstructive pulmonary disease in China[J]. Am J Respir Crit Care Med, 2007, 176 (8): 753- 760.

DOI

5
Chen S , Kuhn M , Prettner K , et al. The global economic burden of chronic obstructive pulmonary disease for 204 countries and territories in 2020-50: A health-augmented macroeconomic modelling study[J]. Lancet Glob Health, 2023, 11 (8): e1183- e1193.

DOI

6
World Health Organization. WHO guidelines on physical activity and sedentary behaviour [EB/OL]. (2020-11-25)[2024-12-25]. https://www.who.int/publications/i/item/9789240015128.

7
Rabe KF , Watz H . Chronic obstructive pulmonary disease[J]. Lancet, 2017, 389 (10082): 1931- 1940.

DOI

8
Chen Z , Chen J , Collins R , et al. China Kadoorie Biobank of 0.5 million people: Survey methods, baseline characteristics and long-term follow-up[J]. Int J Epidemiol, 2011, 40 (6): 1652- 1666.

DOI

9
Chen Z , Lee L , Chen J , et al. Cohort profile: The kadoorie study of chronic disease in China (KSCDC)[J]. Int J Epidemiol, 2005, 34 (6): 1243- 1249.

DOI

10
Ainsworth BE , Haskell WL , Herrmann SD , et al. 2011 compendium of physical activities: A second update of codes and MET values[J]. Med Sci Sports Exerc, 2011, 43 (8): 1575- 1581.

DOI

11
樊萌语, 吕筠, 郭彧, 等. 中国慢性病前瞻性研究: 10个项目地区成人体力活动和休闲静坐时间特征差异的分析[J]. 中华流行病学杂志, 2015, 36 (8): 779- 785.

12
中华人民共和国国家卫生健康委员会医政司. 肥胖症诊疗指南(2024年版)[J]. 中华消化外科杂志, 2024, 23 (10): 1237- 1260.

DOI

13
Cheng SWM , McKeough Z , Alison J , et al. Associations of total and type-specific physical activity with mortality in chronic obstructive pulmonary disease: A population-based cohort study[J]. BMC Public Health, 2018, 18 (1): 268.

DOI

14
孙明希, 温启邦, 涂华康, 等. 4种慢性病共病模式及运动与全因死亡的相关性研究[J]. 中华流行病学杂志, 2022, 43 (12): 1952- 1958.

15
Waschki B , Kirsten A , Holz O , et al. Physical activity is the strongest predictor of all-cause mortality in patients with COPD: A prospective cohort study[J]. Chest, 2011, 140 (2): 331- 342.

DOI

16
Garcia-Rio F , Rojo B , Casitas R , et al. Prognostic value of the objective measurement of daily physical activity in patients with COPD[J]. Chest, 2012, 142 (2): 338- 346.

DOI

17
Kim T , Kim H , Kong S , et al. Association between regular moderate to vigorous physical activity initiation following COPD diagnosis and mortality: An emulated target trial using nationwide cohort data[J]. Chest, 2024, 165 (1): 84- 94.

DOI

18
Moy ML , Gould MK , Liu IA , et al. Physical activity assessed in routine care predicts mortality after a COPD hospitalisation[J]. ERJ Open Res, 2016, 2 (1): 00062- 2015.

19
Yuan LD , Zhang LH , Wang Y , et al. The impact of leisure-time physical activity and sedentary behavior on mortality in patients with chronic obstructive pulmonary disease[J]. Am J Phys Med Rehabil, 2025, 104 (4): e49- e57.

DOI

20
Kontro TK , Sarna S , Kaprio J , et al. The difference in risk of chronic pulmonary disease morbidity and mortality between former elite athletes and ordinary men in Finland[J]. Eur J Sport Sci, 2020, 20 (8): 1140- 1149.

DOI

21
Loprinzi PD , Sng E , Walker JF . Muscle strengthening activity associates with reduced all-cause mortality in COPD[J]. Chronic Illn, 2017, 13 (2): 140- 147.

22
MacDonald DM , Samorodnitsky S , Lock EF , et al. Biomarkers of inflammation and longitudinal evaluation of lung function, physical activity, and grip strength: A secondary analysis in the CASCADE study[J]. Chronic Obstr Pulm Dis, 2024, 11 (4): 396- 405.

23
Obling N , Backer V , Hurst JR , et al. Nasal and systemic inflammation in chronic obstructive pulmonary disease (COPD)[J]. Respir Med, 2022, 195, 106774.

24
Ito JT , Alves LHV , Oliveira LDM , et al. Effect of exercise trai-ning on modulating the TH17/TREG imbalance in individuals with severe COPD: A randomized controlled trial[J]. Pulmonology, 2025, 31 (1): 2441069.

25
Wang XS , Liu C , Liang RN , et al. Elucidating the beneficial impact of exercise on chronic obstructive pulmonary disease and its comorbidities: Integrating proteomic and immunological insights[J]. Br J Pharmacol, 2024, 181 (24): 5133- 5150.

26
Nymand SB , Hartmann JP , Ryrsø CK , et al. Exercise adaptations in COPD: The pulmonary perspective[J]. Am J Physiol Lung Cell Mol Physiol, 2022, 323 (6): L659- L666.

27
Hu YZ, Sun QF, Han YT, et al. Role of lifestyle factors on the development and long-term prognosis of pneumonia and cardiovascular disease in the Chinese population[J]. Chin Med J (Engl), 2024, 8 (2024-08-28)[2024-12-26]. https://pubmed.ncbi.nlm.nih.gov/39193696.

文章导航

/