
1 资料与方法
1.1 数据来源
1.2 分析指标
1.3 统计学分析
2 结果
2.1 2021年中国及全球不同SDI地区增龄性听力损失的患病率及YLD率分布
表1 2021年中国及全球不同SDI地区增龄性听力损失患病率和YLD率Table 1 The prevalence and YLD rates of age-related hearing loss in China and different SDI regions around the world in 2021 |
| Items | Prevalence (/100 000) (95%UI) | ||
| Total | Male | Female | |
| Worldwide | 66 238.16 (59 982.54, 72 669.82) | 69 157.43 (62 608.42, 75 808.62) | 63 650.49 (57 619.38, 69 924.12) |
| China | 82 162.49 (73 288.08, 89 187.21) | 83 239.67 (74 116.27, 90 367.20) | 81 109.96 (72 320.34, 88 205.83) |
| High SDI | 57 650.42 (52 059.12, 63 889.02) | 62 629.90 (56 393.55, 69 611.13) | 53 157.72 (48 076.72, 58 752.49) |
| Upper-middle SDI | 69 115.59 (62 494.18, 75 340.64) | 72 115.95 (65 119.49, 78 576.69) | 66 629.62 (60 161.80, 72 700.20) |
| Middle SDI | 72 365.56 (65 181.43, 78 912.01) | 74 117.43 (66 896.74, 80 775.69) | 70 764.28 (63 699.81, 77 225.86) |
| Lower-middle SDI | 64 439.66 (58 368.22, 71 468.27) | 66 760.33 (60 541.34, 73 990.02) | 62 339.07 (56 372.16, 69 287.31) |
| Low SDI | 61 725.25 (55 749.18, 68 477.67) | 64391.41 (58 283.87, 71 048.12) | 59 216.28 (53 338.05, 65 940.98) |
| Items | YLD rate (/100 000) (95%UI) | ||
| Total | Male | Female | |
| Worldwide | 2 236.75 (1 511.56, 3 155.88) | 2 340.52 (1 579.79, 3 313.09) | 2 146.71 (1 452.03, 3 029.75) |
| China | 2 762.98 (1 855.28, 3 880.68) | 2 854.99 (1 910.45, 4 017.34) | 2 675.33 (1 796.64, 3 751.90) |
| High SDI | 1 805.79 (1 212.69, 2 577.17) | 1 958.63 (1 308.65, 2 798.77) | 1 671.24 (1 126.65, 2 381.55) |
| Upper-middle SDI | 2 316.58 (1 557.53, 3 274.87) | 2 440.79 (1 639.39, 3 448.78) | 2 215.41 (1 491.18, 3 132.33) |
| Middle SDI | 2 480.99 (1 678.17, 3 489.24) | 2 559.40 (1 735.57, 3 607.99) | 2 409.93 (1 630.03, 3 394.81) |
| Lower-middle SDI | 2 313.28 (1 578.35, 3 271.50) | 2 376.01 (1 622.71, 3 355.52) | 2 257.96 (1 539.18, 3 194.87) |
| Low SDI | 2 383.55 (1 623.66, 3 365.68) | 2 429.69 (1 652.47, 3 414.24) | 2 340.55 (1 595.58, 3 305.33) |
SDI, socio-demographic index; YLD, years lived with disability; UI, uncertainty interval. |
2.2 1990—2021年中国增龄性听力损失的性别患病率及YLD率变化趋势
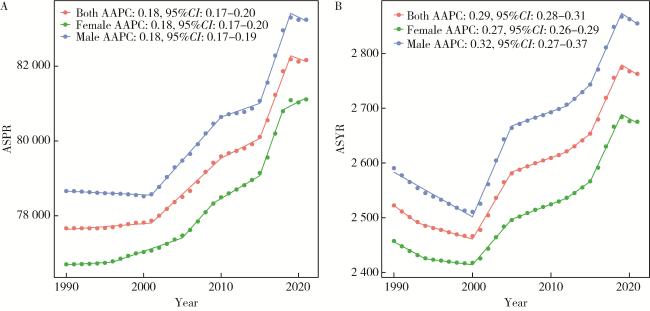
图1 1990—2021年中国增龄性听力损失的性别-年龄标准化患病率(A)及YLD率(B)Figure 1 Sex-age-standardized prevalence rate(A) and YLD rate(B) of age-related hearing loss in China from 1990 to 2021 ASPR, age-standardized prevalence rate; AAPC, average annual percent change; ASYR, age-standardized YLD rate; YLD, years lived with disability. |
2.3 1990—2021年中国及全球不同SDI地区增龄性听力损失的患病率和YLD率分布
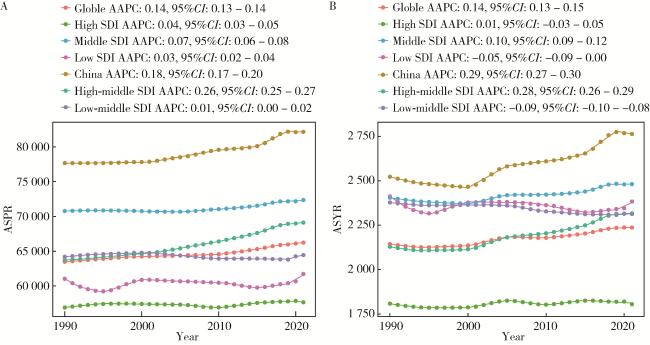
图2 1990—2021年中国及全球不同SDI地区增龄性听力损失的地区-年龄标准化患病率(A)及YLD率(B)Figure 2 Regional-age-standardized prevalence(A) and YLD rates(B) of age-related hearing loss in China and different SDI countries from 1990 to 2021 SDI, socio-demographic index; ASPR, age-standardized prevalence rate; AAPC, average annual percent change; ASYR, age-standardized YLD rate; YLD, years lived with disability. |
2.4 中国增龄性听力损失患病率及YLD率变化趋势的APC
2.5 中国及全球不同SDI地区增龄性听力损失患病率及YLD率的AAPC
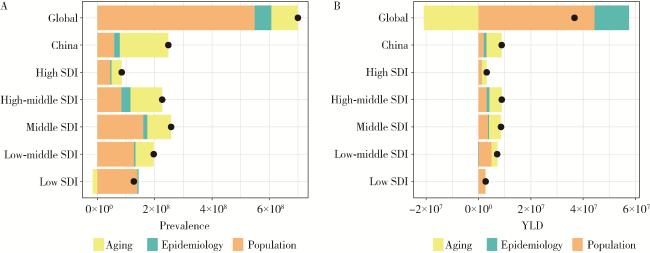
2.6 中国及全球不同SDI地区增龄性听力损失疾病负担改变的分解分析
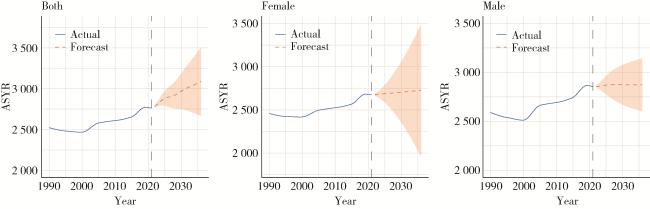
2.7 ARIMA模型定量描述未来15年增龄性听力损失的患病率及YLD率趋势
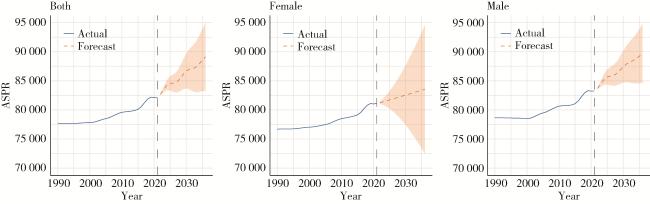
图4 未来15年(2022—2036年)增龄性听力损失性别-年龄标准化患病率趋势预测Figure 4 Prediction of trends in sex-age-standardized prevalence of age-related hearing loss over the next 15 years (from 2022 to 2036) ASPR, age-standardized prevalence rate. |
