
结直肠癌是常见的消化道肿瘤,其发生及发展受环境、饮食习惯、遗传因素等多种因素影响,多由结直肠腺瘤经过一系列变化发展而来。有研究发现,人体肠道菌群结构的变化也与结直肠癌的发生及发展有着密切的联系。肠道菌群随着宿主的生活和饮食习惯进行动态调节,当其结构和功能受到破坏时,可以通过破坏肠黏膜上皮细胞、参与宿主机体代谢和产生致癌物质等方式增加异常隐窝病灶,最终诱发结直肠息肉和癌变[1]。
高原低氧、强辐射的环境会使胃肠黏膜屏障受损和消化系统功能紊乱,导致肠道内细菌移位,进而引起肠道菌群失调[2]。为研究不同海拔导致的肠道菌群变化是否与结直肠腺瘤-结直肠癌的发病率有关,本研究比较了高海拔地区(拉萨)结肠镜检查正常者、结直肠非腺瘤性息肉、结直肠腺瘤及结直肠癌患者的肠道菌群差异,并与低海拔地区(北京)结肠镜检查正常者进行比较,现报道如下。
1 资料与方法
1.1 一般资料
收集2020—2022年于西藏自治区人民医院和北京大学第三医院接受结肠镜检查者的临床资料,排除1个月内应用过抗生素和微生态制剂、有严重心/脑血管疾病、有肝/肾等重要脏器疾病、有明确或疑诊消化系统严重疾病病史、糖尿病及合并感染、不能配合调查或留取粪便标本者。最终纳入西藏自治区人民医院61例患者,根据结肠镜检查结果分为高海拔对照组(结肠镜检查正常者,29例)、结直肠非腺瘤性息肉组(12例)、结直肠腺瘤组(10例)、结直肠癌组(10例),以及北京大学第三医院结肠镜检查正常者17例作为低海拔对照组。所有受试者均签署知情同意书,本研究获得北京大学第三医院医学科学研究伦理委员会批准(医伦审第106-02号)。
1.2 检测方法
1.2.1 粪便菌群分析(16S rRNA测序)
在结肠镜检查的肠道准备前取得所有研究对象的新鲜粪便样本(≥1 g),按照试剂盒(E.Z.N.A.Ⓡ -Soil,美国Omega Bio-Tek公司)说明书提取细菌DNA,用NanoDrop2000(美国Thermo Scientific公司)测定DNA的浓度和纯度(1%琼脂糖凝胶电泳)。使用携带Barcode序列的上游引物338F(5′-ACTCCTACGGGAGGCAGC-3′)和下游引物806R(5′-GGACTACHVG-GGTWTCTAAT-3′)[3]对16S rRNA基因V3~V4可变区进行PCR扩增,并由上海美吉生物医药科技有限公司进行测序(Misep PE300/NovaSep PE250,Illumina公司)。
1.2.2 高通量测序数据分析
1.3 微生物菌群分析方法
α多样性分析内容包括:(1)Sobs指数,即实际观测到的OTU数目;(2)Shannon指数,用于衡量样本多样性;(3)Ace指数,用于衡量物种丰富度。β多样性分析是在门水平上对各样本组进行肠道微生物分型,计算Jensen-Shannon距离,通过围绕中心点的分割算法(partitioning around medoids,PAM)进行聚类,获得最佳聚类K值,然后用主坐标分析(principal co-ordinates analysis,PCoA)进行可视化展示。
用群落柱形图展示各样本组在不同分类学水平的微生物群落组成。根据得到的群落丰度数据,分别在门和属水平对各样本组间的微生物群落进行比较,获得组间差异有统计学意义的物种。
1.4 统计学方法
采用统计学软件SPSS 25.0进行分析。对计量资料进行正态性检验和方差齐性检验,符合正态分布的计量资料用$\bar x \pm s$表示,采用t检验和单因素方差分析进行比较,不符合正态分布的计量资料用中位数表示,采用Mann-Whitney U检验和Kruskal-Wallis H检验进行比较。计数资料用例数(百分率)表示,采用χ2检验进行组间比较。双侧检验,P < 0.05为差异有统计学意义。
2 结果
2.1 研究对象的一般情况
本研究5个样本组研究对象年龄在16~78岁,各组间性别差异无统计学意义,但年龄差异有统计学意义(F=3.534,P=0.011,表 1),进一步两组间比较发现高海拔结直肠癌组与高海拔对照组及低海拔对照组间差异均有统计学意义(P=0.002,P=0.008),表明结直肠癌的发病与年龄有关。
表1 研究对象的一般情况Table 1 General information about the study subjects |
| Items | High-altitude group | Low-altitude control (n=17) | P value | |||
| Control (n=29) | Non-adenomatous polyp (n=12) | Adenoma (n=10) | Colorectal cancer (n=10) | |||
| Gender, n (%) | ||||||
| Male | 15 (51.7) | 5 (41.7) | 5 (50.0) | 3 (30.0) | 8 (47.1) | 0.813 |
| Female | 14 (48.3) | 7 (58.3) | 5 (50.0) | 7 (70.0) | 9 (52.9) | |
| Age/years, $\bar x \pm s$ | 40.38±13.76 | 48.33±15.59 | 49.90±8.13 | 55.30±11.26 | 41.53±11.05 | 0.011 |
2.2 物种多样性分析
α多样性分析结果提示,高海拔结直肠癌组肠道菌群物种的OTU数目及物种多样性均明显高于高海拔非腺瘤性息肉组(PSobs=0.045,PShannon=0.036)及低海拔对照组(PSobs=0.047,PShannon=0.034),且其物种丰富度也明显高于低海拔对照组人群(PAce=0.028,表 2)。
表2 α多样性检验结果Table 2 The results of alpha diversity test |
| Index | High-altitude group | Low-altitude control (n=17) | |||
| Control (n=29) | Non-adenomatous polyp (n=12) | Adenoma (n=10) | Colorectal cancer (n=10) | ||
| Sobs | 167.6±53.52 | 160.7±45.3 | 167.8±65.9 | 207.7±57.8 | 155.0±59.4 |
| Shannon | 2.814±0.755 | 2.871±0.542 | 2.793±1.026 | 3.376±0.499 | 2.814±0.755 |
| Ace | 196.9±59.5 | 191.7±53.2 | 198.8±66.8 | 234.9±63.6 | 175.8±63.9 |
Data are expressed as $\bar x \pm s$. |
对5个样本组进行β多样性分析,在门水平上的分析发现各组间β多样性差异无统计学意义(P=0.127),在此水平对肠道微生物肠型进行聚类,得到4种肠型(图 1),分别为厚壁菌门(Firmicutes)、厚壁菌门_1(Firmicutes_1)、拟杆菌门(Bacteroidetes)、厚壁菌门_2(Firmicutes_2),各组均可见4种肠型,表明通过肠道微生物聚类并不能明确区分各个样本组。
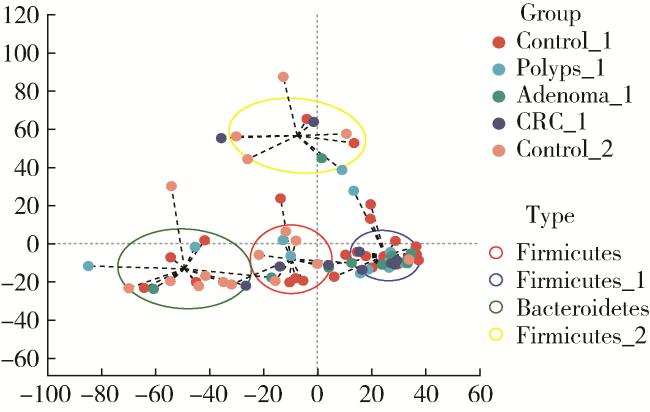
图1 各组间肠型聚类分析Figure 1 Analysis of enterotypes among groups X-axis and Y-axis are distance matrices calculated based on PCoA, indicating the two selected principal component axes, and the percentage indicates the value of the degree of explanation of the differences in the composition of the samples by the principal components; the scales of the X-axis and the Y-axis are relative distances without any practical significance. Control_1, high-altitude control; Polyps_1, high-altitude non-adenomatous polyp; Adenoma_1, high-altitude adenoma; CRC_1, high-altitude colorectal cancer; Control_2, low-altitude control. |
2.3 微生物群落组成分析
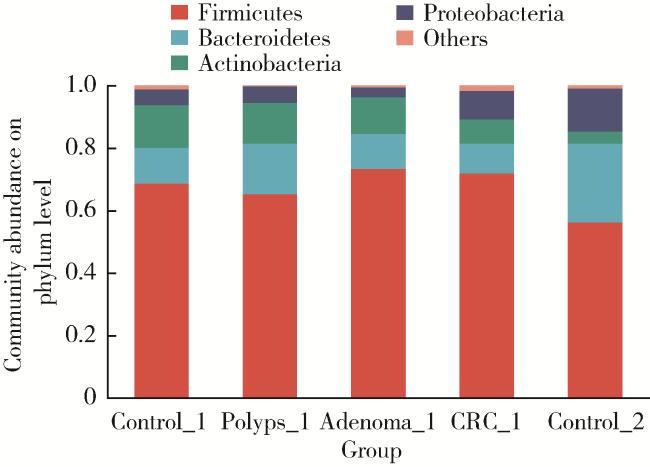
门水平的分析发现,5个样本组的优势物种均为厚壁菌门、拟杆菌门、放线菌门(Actinobacteria)、变形菌门(Proteobacteria),其中,厚壁菌门在高海拔腺瘤组占比最高,拟杆菌门及变形菌门在低海拔对照组占比最高,而放线菌门在高海拔对照组占比最高(图 2)。
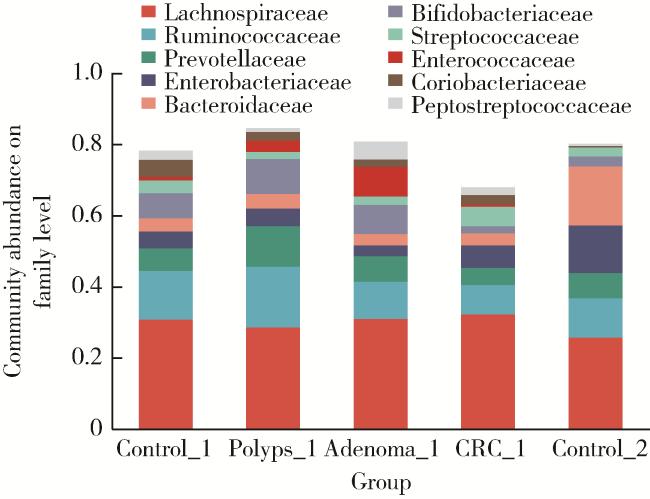
科水平的分析发现,丰度前10位的优势物种占各组总序列的相对比例均超过60%(图 3),且各组在科水平的优势物种占比最高的均为毛螺菌科(Lachnospiraceae),但各菌科在各组内所占的相对丰度不同,其中毛螺菌科在结直肠癌组中占比最高,在低海拔对照组中占比最低。
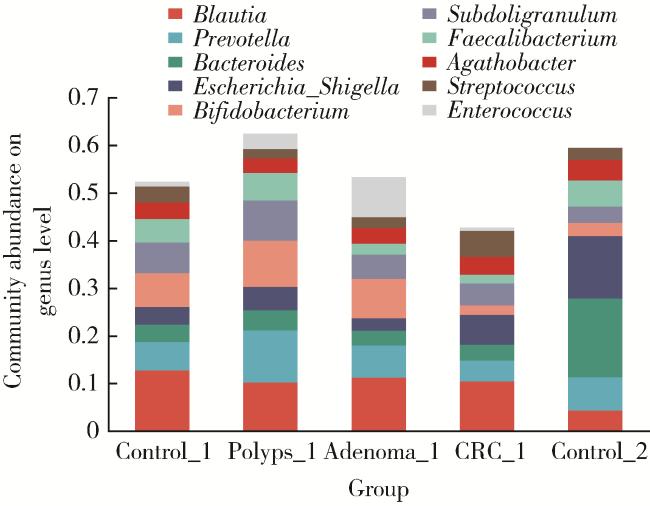
属水平的分析发现,高海拔对照组、非腺瘤性息肉组、腺瘤组及低海拔对照组丰度前10位的优势物种占据总序列的相对比例均超过50%,而结直肠癌样本组中该比例低于50%。各样本组中丰度前5位的优势物种均为布鲁菌属(Blautia)、普雷沃氏菌属(Prevotella)、拟杆菌属(Bacteroides)、埃希氏-志贺氏菌属(Escherichia-Shigella)、双歧杆菌属(Bifido-bacterium),但在各样本组中的相对丰度不同(图 4)。
2.4 微生物群落差异性分析
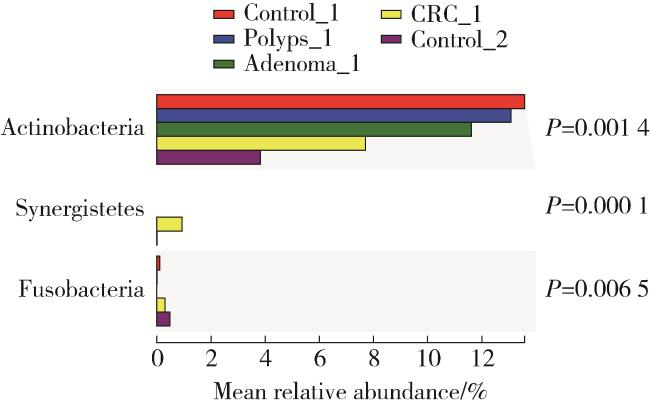
门水平的物种差异性分析表明,本研究5个样本组间放线菌门(P=0.001 4)、互养菌门(Synergistetes,P≤0.000 1)和梭杆菌门(Fusobacteria,P=0.006 5)差异有统计学意义(图 5)。低海拔对照组放线菌门丰度明显低于高海拔各组,高海拔结直肠癌组放线菌门丰度明显低于其他高海拔组;互养菌门只在高海拔结直肠癌组中检测到;梭杆菌门只在高海拔对照组、结直肠癌组及低海拔对照组中检测到,且三组间丰度差异有统计学意义,低海拔对照组较高海拔对照组和结直肠癌组高。
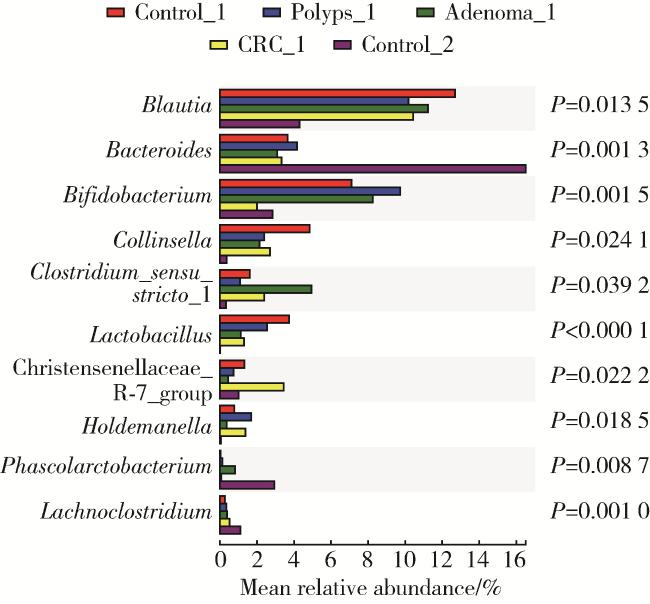
如图 6所示,本研究5个样本组间在属水平的丰度差异前10位的菌属分别为布鲁菌属、拟杆菌属、双歧杆菌属、科林斯菌属(Collinsella)、斯特里斯托梭菌属1(Clostridium_sensu_stricto_1)、乳酸杆菌属(Lactobacillus)、克里斯滕森氏菌科R-7群(Christensenellaceae_R-7_group)、霍尔德曼氏菌属(Holdemanella)、考拉杆菌属、梭状芽孢杆菌属(Lachnoclostridium)。其中低海拔对照组中拟杆菌属、考拉杆菌属、梭状芽孢杆菌属丰度明显高于高海拔所有组;布鲁菌属、科林斯菌属在高海拔对照组中丰度最高;低海拔对照组中未检测到乳酸杆菌属,而高海拔各样本组的乳酸杆菌属丰度差异有统计学意义,高海拔对照组明显高于其他3组;高海拔各样本组中,结直肠癌组双歧杆菌丰度明显下降,而克里斯滕森氏菌科R-7群的丰度明显升高。
3 讨论
肠道菌群被誉为人类“第二基因组”,包括细菌、真菌、病毒,绝大部分是细菌。通常所说的肠道菌群指的是结肠中的细菌,约有100万亿个,约为人体细胞总数的10倍,在系统发育地位上分属于厚壁菌门、拟杆菌门、变形菌门、放线菌门、疣微菌门(Verrucomicrobia)和梭杆菌门,其中拟杆菌门和厚壁菌门为主要优势菌群[7]。不同菌群之间相互制约,维持着肠道微生态系统的稳态。
Kostic等[10]评估了梭杆菌门下具核梭杆菌(Fusobacterium nucleatum)对肠道浸润性免疫细胞的影响,观察到无论在APC-mini小鼠还是在人类结肠黏膜标本中,促炎标记物,如环氧合酶2(cyclooxygenase-2,COX-2)、白细胞介素(interleukin,IL)-8、IL-6、IL-1β和肿瘤坏死因子(tumor necrosis factor α,TNF-α)的表达均与具核梭杆菌之间存在强相关性,同时具核梭杆菌还能诱导核因子κB(nuclear factor-κB,NF-κB)介导的促炎反应,并可能由此促进了结直肠肿瘤的进展。本研究发现高海拔结直肠癌组患者肠道梭杆菌门菌群比例较高海拔对照组明显升高,也验证了梭杆菌门能促进结直肠癌发展这一结论。
双歧杆菌是人体肠道的主要有益菌,研究发现双歧杆菌具有生物拮抗、防治肠道感染、营养、免疫及抗衰老、抗肿瘤等作用,其能调节肠道的正常蠕动,通过磷壁酸与肠黏膜上皮细胞相互结合,与其他厌氧菌一起共同占据肠黏膜表面,形成具有保护作用的生物学屏障,阻止致病菌的侵入与定植[15-18]。单体栋等[19]利用荧光定量PCR研究发现,在高原缺氧的复杂环境下,双歧杆菌的数量在第2、4、6天较平原对照组相对应时间相比显著减少。还有研究表明,低氧、低温、强辐射等环境因素会导致双歧杆菌数量减少,从而引起肠道菌群发生紊乱[20]。本研究结果显示,高海拔地区结直肠癌患者肠道内双歧杆菌属、乳酸杆菌属丰度下降,且较低海拔对照组丰富度低,表明高海拔可能会导致肠道内有益菌数量下降,从而导致菌群失调,促进结直肠癌的发展。
综上所述,通过比较高海拔地区(西藏)结直肠良恶性肿瘤及低海拔地区(北京)结肠镜检查正常人群的肠道菌群,本研究发现高海拔地区结直肠良性及恶性肿瘤人群间肠道菌群结构发生了变化,且高海拔和低海拔地区人群肠道内菌群多样性、丰富度及微生物群落丰度组成存在差异,这种差异可能与结直肠腺瘤、结直肠癌发病有关。将来的研究中应考虑按海拔高度分组,探讨不同海拔高度人群间的菌群差异,以进一步证实海拔因素与肠道菌群变化的关系。
