1 资料与方法
1.1 患者一般资料
1.2 患者基线数据收集
1.3 影像学评价指标
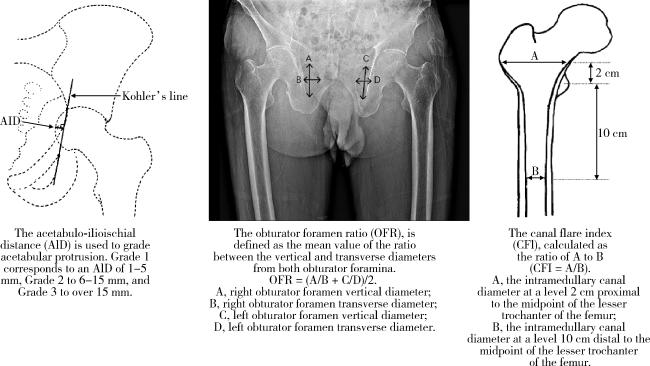
1.4 统计学分析
2 结果
2.1 整体基线数据
表1 2001—2012入院组和2013—2024入院组患者临床及影像学参数的比较(以髋关节数量计算)Table 1 Comparison of clinical and radiographic parameters between the 2001-2012 inpatient group and the 2013-2024 inpatient group (calculated by number of hip joints) |
| Items | Total | 2001-2012 inpatient group | 2013-2024 inpatient group | Statistic | P value |
| Gender | χ2=8.40 | 0.004 | |||
| Male | 866 (86.8) | 350 (83.1) | 516 (89.4) | ||
| Female | 132 (13.3) | 71 (16.9) | 61 (10.6) | ||
| BMI/(kg/m2) | 23.0 (19.6, 26.0) | 22.2 (19.1, 25.3) | 23.5 (20.2, 26.2) | Z=-3.04 | 0.002 |
| Surgical side | χ2=0.07 | 0.796 | |||
| Left | 512 (51.3) | 218 (51.8) | 294 (51.0) | ||
| Right | 486 (48.7) | 203 (48.2) | 283 (49.1) | ||
| Age at onset/years | 21.0 (16.0, 23.0) | 19.0 (16.0, 23.0) | 21.0 (18.0, 24.0) | Z=-3.58 | < 0.001 |
| Age at diagnoses/years | 29.0 (22.0, 38.0) | 28.00 (21.0, 37.0) | 29.0 (22.0, 39.0) | Z=-1.93 | 0.054 |
| Age at surgery/years | 40.0 (31.0, 50.0) | 38.0 (29.0, 50.0) | 41.0 (32.0, 50.0) | Z=-1.71 | 0.087 |
| Diagnostic delay/years | 8.0 (4.0, 16.0) | 8.0 (4.0, 15.0) | 8.0 (4.0, 16.0) | Z=-0.62 | 0.537 |
| Treatment interval/years | 19.0 (12.0, 28.0) | 19.0 (12.0, 28.0) | 20.0 (12.0, 27.0) | Z=-0.62 | 0.534 |
| RDCI | 0 (0, 0) | 0 (0, 0) | 0 (0, 0) | Z=-0.26 | 0.794 |
| HLA-B27 positive (hips) | 908 (91.0) | 383 (91.0) | 525 (91.0) | χ2=0.00 | 0.994 |
| Hb/(g/L) | 134.0 (118.0, 145.0) | 135.0 (118.0, 146.0) | 134.0 (118.0, 145.0) | Z=-0.38 | 0.707 |
| ESR/(mm/h) | 22.0 (11.0, 40.0) | 23.0 (11.0, 41.0) | 22.0 (10.0, 39.0) | Z=-0.98 | 0.326 |
| CRP/(mg/L) | 12.6 (5.4, 28.7) | 14.8 (6.2, 31.0) | 12.2 (5.3, 26.1) | Z=-1.87 | 0.062 |
| ALB/(g/L) | 42.4 (39.3, 45.4) | 42.2 (39.3, 45.2) | 42.5 (39.4, 45.7) | Z=-0.38 | 0.700 |
| BASDAI | 3.9 (2.9, 5.1) | 3.8 (2.9, 5.0) | 3.9 (2.9, 5.1) | Z=-0.48 | 0.634 |
| BASFI | 57.0 (45.0, 74.0) | 59.5 (45.8, 75.0) | 56.0 (45.0, 72.0) | Z=-1.38 | 0.166 |
| HHS | 36.0 (25.0, 44.0) | 34.0 (23.0, 41.0) | 37.0 (25.0, 45.0) | Z=-4.08 | < 0.001 |
| SF-12 MCS | 43.0 (38.4, 48.8) | 43.0 (38.2, 48.9) | 43.2 (38.5, 48.7) | Z=-0.80 | 0.424 |
| SF-12 PCS | 33.4 (25.6, 38.7) | 33.9 (25.6, 38.7) | 33.1 (26.0, 38.7) | Z=-0.43 | 0.671 |
| Bony ankyloses (hips) | 401 (40.2) | 167 (39.7) | 234 (40.6) | χ2=0.08 | 0.778 |
| Protrusion (hips) | 148 (14.8) | 61 (14.5) | 87 (15.1) | χ2=0.07 | 0.796 |
| Dislocation (hips) | 98 (9.8) | 46 (10.9) | 52 (9.0) | χ2=1.01 | 0.316 |
| OFR | 1.5 (1.2, 1.7) | 1.5 (1.2, 1.7) | 1.5 (1.2, 1.8) | Z=-1.28 | 0.201 |
| CFI | 3.2 (2.6, 3.8) | 3.2 (2.6, 3.8) | 3.2 (2.6, 3.8) | Z=-0.15 | 0.882 |
| NSA/(°) | 141.0 (135.0, 148.0) | 141.0 (135.0, 148.0) | 141.0 (134.0, 148.0) | Z=-0.08 | 0.939 |
Data are presented as n (%) or M (P25, P75). BMI, body mass index; RDCI, rheumatic disease comorbidity index; HLA-B27, human leucocyte antigen-B27; Hb, hemoglobin; ESR, erythrocyte sedimentation rate; CRP, C-reactive protein; ALB, albumin; BASDAI, Bath ankylosing spondylitis disease activity index; BASFI, Bath ankylosing spondylitis functional index; HHS, Harris hip score; SF-12, short form 12-item health survey; MCS, mental component summary; PCS, physical component summary; OFR, obturator foramen ratio; CFI, canal flare index; NSA, neck shaft angle. |
2.2 参数趋势分析
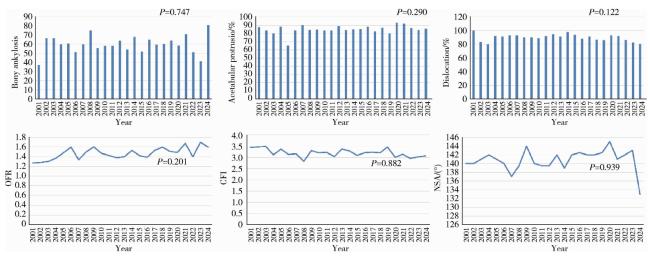
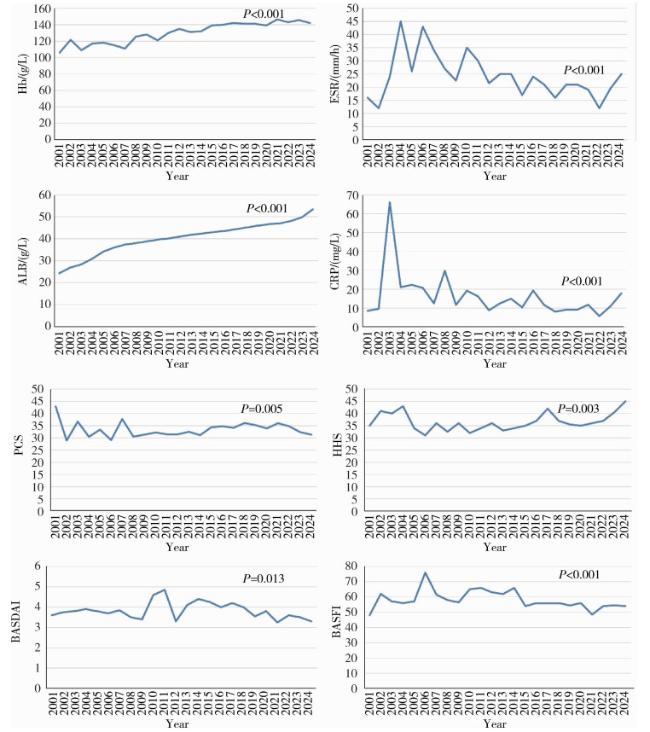
图3 实验室检查结果和疾病相关参数的趋势分析Figure 3 Trend analysis of laboratory test results and disease-related parameters Hb, hemoglobin; ESR, erythrocyte sedimentation rate; CRP, C-reactive protein; ALB, albumin; PCS, physical component summary; HHS, Harris hip score; BASDAI, Bath ankylosing spondylitis disease activity index; BASFI, Bath ankylosing spondylitis functional index. |