年龄增长是视力障碍的主要危险因素[8],《“十四五”全国眼健康规划(2021—2025年)》将老年人作为重点关注人群,强调“提高重点人群眼健康水平”[9]。由于人口老龄化、年龄相关性疾病负担增加等原因,中国老年人视力障碍的患病率呈现逐年上升趋势[10]。既往研究发现,教育、职业、财富与自评社会经济地位也是老年人视力障碍的主要影响因素[11-12]。目前与中国老年人视力障碍相关的研究多为流行病学调查[13-15],探索社会经济地位对视力障碍影响的研究较少,主要为单一地区、小范围的横断面调查,且研究对象的平均年龄较低[16],缺乏具有全国代表性、关注老年人群的研究。本研究利用全国专项调查数据,分析中国老年人社会经济地位与视力障碍的相关性,并比较2008—2018年的变化情况,为进一步推动实施全国眼健康规划、提高我国老年人眼健康水平提供依据。
1 资料与方法
1.1 数据来源
1.2 变量选择
1.3 统计学分析
使用Stata 17.0软件进行统计分析。由于CLHLS调查在抽样设计中对高龄和男性老年人实施了过抽样策略,因此本研究的所有统计推断均对样本权重进行了处理。采用频数和百分比描述研究对象的基本特征,采用卡方检验评估不同家庭收入、受教育程度、退休前职业、城乡和地区群体的视力障碍患病率是否存在差异,并报告基于抽样设计调整的F统计量。通过构建6个二分类Logistic回归模型,进一步分析家庭收入、受教育程度、退休前职业与视力障碍之间的关联,并比较2008—2018年的变化情况。采用逐步进入法依次加入控制变量:所有模型均控制了年龄、性别和婚姻状况等个体特征;模型1~3分别评估控制上述个体特征后,家庭收入、受教育程度、退休前职业与视力障碍的相关性;模型4评估进一步控制受教育程度、退休前职业的影响后,家庭收入与视力障碍的相关性(受教育程度、退休前职业同理);模型5在模型4的基础上,控制了城乡和地区因素;模型6在模型5的基础上,进一步控制生活方式因素。P < 0.05为差异有统计学意义。
2 结果
2.1 研究对象基本特征
年龄为85岁及以上的受访者居多,女性占比更高。已婚且与伴侣居住的受访者在2018年的占比(46.74%)较2008年(36.35%)有所上升。2008年受访者家庭收入五分位的各组占比为17.53%~22.56%,2018年各组占比为19.18%~20.61%,分布较为均匀。在受教育程度方面,2018年文盲群体占比(48.22%)较2008年(61.87%)有所下降,初中及以上学历群体占比(19.42%)较2008年(9.97%)有所上升。在所有受访者中,退休前职业占比前三位的分别为农业(2008年:66.25%;2018年:61.64%)、职员或工人(2008年:13.37%;2018年:14.46%)、专业技术或管理类(2008年:7.37%;2018年:11.17%)。2008年居住在农村的受访者居多(59.92%),而2018年居住在城镇的居多(56.99%)。居住在东部地区的受访者占比最大,其次为西部地区和中部地区,东北地区占比最小。研究对象的基本特征见表 1。
表1 研究对象的基本特征Table 1 Characteristics of participants |
| Variables | Year 2008 (n=12 970), n (%) | Year 2018 (n=9 702), n (%) |
| Age/years | ||
| 65-74 | 2 485 (19.16) | 2 392 (24.65) |
| 75-84 | 2 576 (19.86) | 2 401 (24.75) |
| 85 and above | 7 909 (60.98) | 4 909 (50.60) |
| Gender | ||
| Female | 7 340 (56.59) | 5 350 (55.14) |
| Male | 5 630 (43.41) | 4 352 (44.86) |
| Marital status | ||
| Others | 8 255 (63.65) | 5 167 (53.26) |
| Currently married | 4 715 (36.35) | 4 535 (46.74) |
| Household income quintile | ||
| Lowest | 2 857 (22.03) | 1 970 (20.31) |
| Lower middle | 2 926 (22.56) | 1 973 (20.34) |
| Middle | 2 442 (18.83) | 1 861 (19.18) |
| Upper middle | 2 472 (19.06) | 2 000 (20.61) |
| Highest | 2 273 (17.53) | 1 898 (19.56) |
| Educated level | ||
| Illiterate | 8 024 (61.87) | 4 678 (48.22) |
| Primary school | 3 653 (28.16) | 3 140 (32.36) |
| Junior high school and above | 1 293 (9.97) | 1 884 (19.42) |
| Job before retirement | ||
| Professional, technical or managerial personnel | 956 (7.37) | 1 084 (11.17) |
| Commercial, service or industrial worker | 1 734 (13.37) | 1 403 (14.46) |
| Self-employed | 249 (1.92) | 181 (1.87) |
| Agriculture | 8 592 (66.25) | 5 980 (61.64) |
| Houseworker | 1 075 (8.29) | 655 (6.75) |
| Military personnel | 85 (0.66) | 90 (0.93) |
| Never worked | 86 (0.66) | 143 (1.47) |
| Others | 193 (1.49) | 166 (1.71) |
| Residence | ||
| Rural | 7 771 (59.92) | 4 173 (43.01) |
| Urban | 5 199 (40.08) | 5 529 (56.99) |
| Location | ||
| East | 5 202 (40.11) | 4 554 (46.94) |
| Middle | 3 200 (24.67) | 2 166 (22.33) |
| West | 3 510 (27.06) | 2 514 (25.91) |
| North-east | 1 058 (8.16) | 468 (4.82) |
| Smoking | ||
| Never | 8 610 (66.38) | 6 688 (68.93) |
| Past or current | 4 360 (33.62) | 3 014 (31.07) |
| Drinking | ||
| Never | 8 953 (69.03) | 7 080 (72.97) |
| Past or current | 4 017 (30.97) | 2 622 (27.03) |
| Regular exercising | ||
| Never | 7 812 (60.23) | 5 919 (61.01) |
| Past or current | 5 158 (39.77) | 3 783 (38.99) |
| Fruit | ||
| Not often | 7 704 (59.40) | 5 222 (53.82) |
| Often | 5 266 (40.60) | 4 480 (46.18) |
2.2 中国老年人视力障碍的患病情况
2008年中国65岁及以上老年人的视力障碍患病率为16.92%(95%CI: 15.91%~17.98%),2018年患病率上升至18.45%(95%CI: 17.41%~19.53%)。按社会经济地位、城乡和地区分组的视力障碍患病率见表 2。对各年份不同家庭收入水平、受教育程度和退休前职业群体的视力障碍患病率进行比较,差异均有统计学意义(P < 0.05)。2008年城乡之间的差异无统计学意义(P=0.456),2018年城乡之间的差异有统计学意义(P=0.029);各年份地区之间的差异均无统计学意义(P>0.05)。
表2 2008—2018年中国老年人按社会经济地位、城乡和地区分组的视力障碍患病率Table 2 Prevalence of vision impairment among Chinese elderly grouped by socioeconomic status, residence, and location from 2008 to 2018 |
| Variables | Year 2008, n (%)a | Year 2018, n (%)a |
| Household income quintile | ||
| Lowest | 1 237 (19.87) | 774 (20.59) |
| Lower middle | 1 218 (17.87) | 807 (20.73) |
| Middle | 981 (16.37) | 654 (17.45) |
| Upper middle | 881 (14.73) | 728 (15.73) |
| Highest | 802 (15.70) | 611 (17.75) |
| F=2.924b, P=0.020 | F=3.218b, P=0.012 | |
| Educated level | ||
| Illiterate | 3 855 (22.99) | 2 388 (28.49) |
| Primary school | 1 029 (14.24) | 816 (14.82) |
| Junior high school and above | 235 (9.53) | 370 (13.47) |
| F=46.582b, P < 0.001 | F=69.762b, P < 0.001 | |
| Job before retirement | ||
| Professional, technical or managerial personnel | 215 (11.69) | 245 (12.37) |
| Commercial, service or industrial worker | 499 (13.70) | 414 (15.33) |
| Self-employed | 88 (12.46) | 60 (17.14) |
| Agriculture | 3 574 (18.61) | 2 380 (19.94) |
| Houseworker | 606 (26.24) | 321 (23.44) |
| Military personnel | 23 (13.62) | 25 (17.51) |
| Never worked | 45 (21.32) | 78 (22.85) |
| Others | 69 (13.84) | 51 (18.23) |
| F=5.804b, P < 0.001 | F=4.356b, P < 0.001 | |
| Residence | ||
| Rural | 3 142 (17.30) | 1 631 (19.63) |
| Urban | 1 977 (16.50) | 1 943 (17.29) |
| F=0.556b, P=0.456 | F=4.789b, P=0.029 | |
| Location | ||
| East | 2 048 (17.02) | 1 639 (17.24) |
| Middle | 1 291 (17.83) | 830 (18.77) |
| West | 1 394 (16.97) | 972 (20.76) |
| North-east | 386 (14.10) | 133 (16.61) |
| F=1.086b, P=0.353 | F=2.531b, P=0.055 |
a, adjusted prevalence by sample weights; b, design-based F value, instead of uncorrected Chi-square value. |
2.3 中国老年人视力障碍的Logistic回归分析
2008年和2018年中国老年人视力障碍的Logistic回归分析结果分别见表 3和表 4。2008年,控制年龄、性别、婚姻等个体特征后,与低收入群体相比,高收入和中高收入群体患视力障碍的风险较低(模型1:分别为OR=0.785,95%CI:0.620~0.994;OR=0.713,95%CI:0.562~0.905),控制受教育程度和退休前职业后,组间差异均无统计学意义(模型4:P>0.05)。在教育方面,与文盲相比,小学学历、初中及以上学历群体患视力障碍的风险较低(模型2:分别为OR=0.688,95%CI:0.575~0.824;OR=0.487,95%CI:0.368~0.644),这一现象在逐步控制了家庭收入和退休前职业、城乡和地区、生活方式等因素后仍有统计学意义,但后两组与文盲组的差距逐步缩小(模型6:分别为OR=0.718,95%CI:0.594~0.868;OR=0.510,95%CI:0.366~0.712)。在职业方面,与退休前从事专业技术或管理类职业的群体相比,从事农业和家务劳动的群体患视力障碍的风险较高(模型3:分别为OR=1.418,95%CI:1.061~1.895;OR=1.729,95%CI:1.110~2.691),控制家庭收入和受教育程度后,组间差异均无统计学意义(模型4:P>0.05)。
表3 2008年中国老年人视力障碍的Logistic回归分析(n=12 970)Table 3 Logistic regression analyses on vision impairment among Chinese elderly in 2018 (n=12 970) |
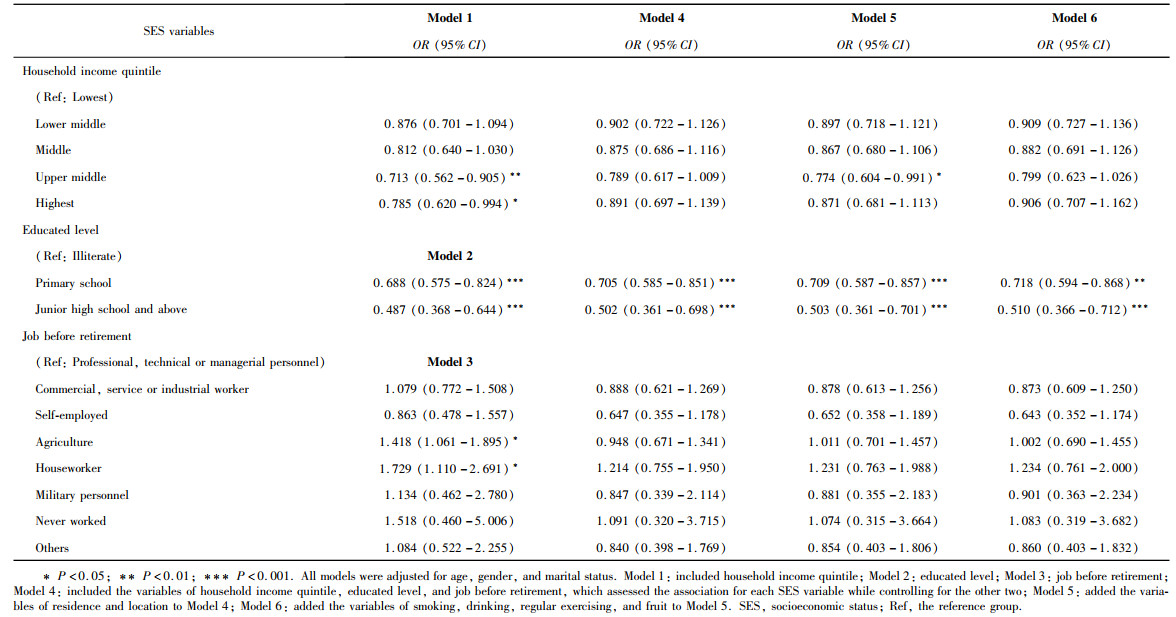 |
表4 2018年中国老年人视力障碍的Logistic回归分析(n=9 702)Table 4 Logistic regression analyses on vision impairment among Chinese elderly in 2018 (n =9 702) |
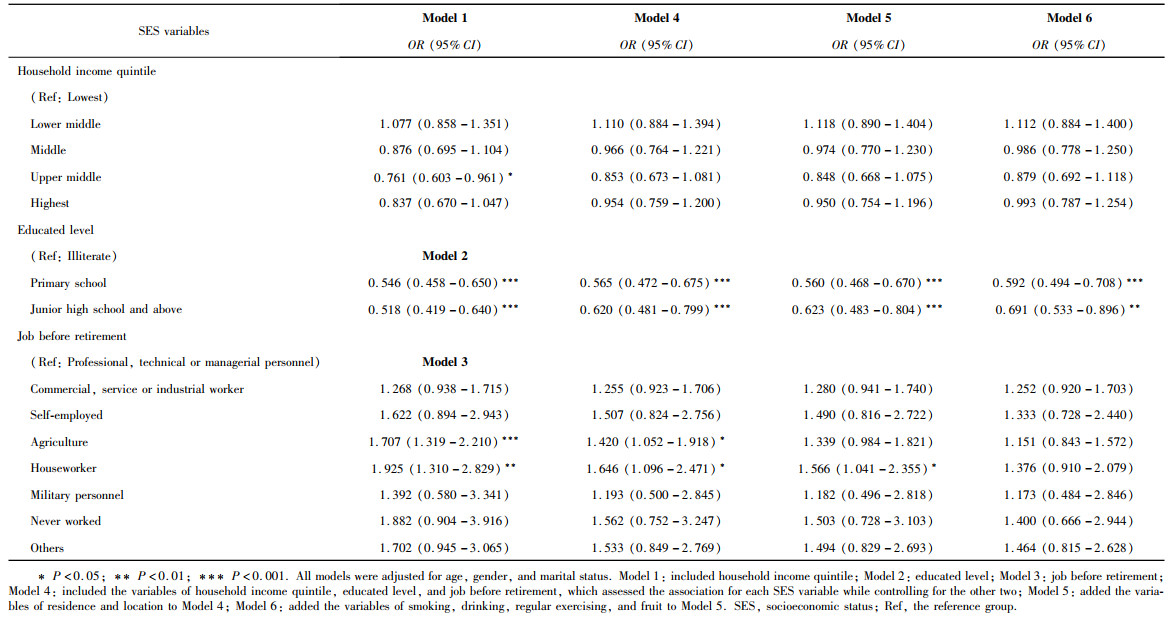 |
2018年,与低收入群体相比,中高收入群体患视力障碍的风险较低(模型1:OR=0.761,95%CI:0.603~0.961),且与2008年相比,与低收入群体的差距缩小。然而,控制受教育程度和退休前职业后,组间差异均无统计学意义(模型4:P>0.05)。在教育方面,与文盲组相比,小学学历、初中及以上学历群体患视力障碍的风险较低(模型2:分别为OR=0.546,95%CI:0.458~0.650;OR=0.518,95%CI:0.419~0.640),其中,与2008年相比,小学组与文盲组的差距增大,初中及以上组与文盲组、小学组的差距缩小。逐步控制家庭收入和退休前职业、城乡和地区、生活方式等因素后,差异仍有统计学意义,但两组与文盲组的差距逐步缩小(模型6:分别为OR=0.592,95%CI:0.494~0.708;OR=0.691,95%CI:0.533~0.896),且初中及以上组的患病风险高于小学组。在职业方面,与退休前从事专业技术或管理类职业的群体相比,从事农业和家务劳动的群体患视力障碍的风险较高(模型3:分别为OR= 1.707,95%CI:1.319~2.210;OR=1.925,95%CI:1.310~2.829),且与2008年相比,两个群体间的差距有所增大。
3 讨论
3.1 中国老年人视力障碍状况
本研究结果显示,2008—2018年中国老年人视力障碍的患病率呈现上升趋势,与既往研究结论一致[10, 26]。本研究结果表明,中国老年人家庭收入、受教育程度、退休前职业与视力障碍之间存在关联,主要体现在:与低收入群体相比,中高收入群体患视力障碍的风险较低;与文盲群体相比,接受过教育的群体患病风险较低;与退休前从事专业技术或管理类职业的群体相比,退休前从事农业、家务劳动的群体患病风险较高,与既往研究结论一致[8, 11, 27-32]。此外,2008—2018年,不同家庭收入群体患视力障碍风险的差距缩小;不同受教育程度群体患病风险的差距整体缩小,但小学学历群体与文盲群体的差距增大;退休前各职业类型群体患病风险的差距增大。
3.2 中国老年人受教育程度与视力障碍的相关性较为明显
本研究结果显示,2008—2018年,在所有Logistic回归模型中,不同受教育程度群体患视力障碍风险的差异始终显著,且与家庭收入和退休前职业因素相比,结果更为稳健,提示中国老年人受教育水平与视力障碍的相关性较为明显。2008年,受教育程度越高,视力障碍的风险越低。分析其可能的原因是,教育通过改善认知能力、健康行为等因素持续影响健康水平[33-36]。2018年,仅控制个体特征时,初中及以上学历群体患视力障碍的风险略低于小学学历群体,但进一步控制家庭收入和退休前职业、城乡和地区、生活方式等因素后,初中及以上学历群体的风险则高于小学组,与既往研究发现的教育和健康水平间可能存在的倒“U”型关系有相似之处[37]。分析其可能的原因是,2008—2018年,智能手机的普及催生了移动互联网的爆发,我国互联网的发展处于移动互联与生态扩张时期,并开始向老年人群体渗透[38],2018年初中及以上学历群体占全部网民群体的81.8%[39],更易遭受数字化时代的新型视力损伤暴露。因此,在推动实施眼健康规划的过程中,除了需要特别关注文盲老年人,为其提供免文字指引的视力筛查,或利用短视频、广播剧代替文字宣传进行健康教育,还应关注受教育程度较高的老年人,对其进行数字健康干预,如开发能够自动调节屏幕色温或亮度的适老化“银发”数字健康产品。
本研究进一步的分析结果显示,无论是2008年还是2018年,控制家庭收入和退休前职业、城乡和地区、生活方式因素等变量后,小学组、初中及以上组与文盲组患视力障碍风险的差距均逐步缩小,提示可以通过间接干预降低与教育相关的视力障碍患病风险。因此,如果通过识别个体的受教育程度进行直接干预存在实施层面的困难,而间接的政策干预或许能够降低特定受教育程度群体的患病风险,如面向农村低收入人群的“光明工程白内障复明项目”[40],通过改善特定人群获得眼健康医疗卫生服务的机会,切断由教育至视力障碍的因果链中的关键环节。
3.3 中国老年人家庭收入、退休前职业与视力障碍的关联变化
本研究发现,2008—2018年,中高收入和高收入老年人患视力障碍的风险与低收入群体的差距有所缩小。一方面,得益于面向贫困群体的眼健康服务项目的开展,以及医保报销范围的逐步扩大,中国低收入老年人获得眼健康医疗卫生服务的机会有所增加;另一方面,本研究的单因素分析结果显示,中高收入和高收入群体的视力障碍患病率在10年间的增长率高于低收入群体,因此中高收入群体视力障碍风险的增加,可能是由于这些人群嵌入数字生活的时间点较早、程度较深,电子屏幕暴露时间较长。未来的研究需要进一步探究不同家庭收入群体间患病差距缩小的具体原因。此外,2008—2018年,从事农业、家务劳动群体患视力障碍的风险与专业技术或管理类群体的差距有所增大,这可能与不同职业特征人群的健康素养差异有关[41],因此,在进一步推动实施眼健康规划的过程中,应更加关注务农和从事家务劳动的群体,有针对性地开展眼健康素养的干预和监测。
综上所述,本研究发现中国老年人视力障碍患病率在2008—2018年间有所上升,且家庭收入、受教育程度、退休前职业等社会经济地位因素与老年人视力障碍存在相关性。进一步分析显示,2008—2018年不同社会经济地位的老年人群体患视力障碍风险的差距呈现出复杂变化,例如不同受教育程度群体之间的差距整体缩小,但小学学历群体与文盲群体的差距有所增大。本研究的局限性主要有以下几方面:首先,由于CLHLS调查在测量视力时要求受访者摘下眼镜,因此仅能依据未矫正视力判断受访者是否存在视力障碍,未来研究若能获得日常视力或最佳矫正视力数据,可进一步探究社会经济地位与因为未矫正的屈光不正或其他眼病引起的视力障碍之间的关联;其次,由于CLHLS调查中与视力障碍相关的慢性病自报患病率与既往流行病学调查结果存在较大差异,本研究未将受访者自报的慢性病患病情况作为控制变量纳入Logistic回归模型。