健康行动过程取向(health action process approach, HAPA)模型是一种社会认知框架,认为健康行为的采纳、启动和维持是一个结构化的过程,包括动机、意向和行动阶段[3]。一旦形成了改变健康行为的意图,就应该计划、启动和维持这种改变,其中动机阶段的风险感知和结果预期影响行为意图,行为意图影响行动计划和应对计划,而行动计划和应对计划又导致行为的产生和维持。此外,HAPA模型强调了自我效能的重要性,认为行动自我效能、维持自我效能和恢复自我效能均对健康行为产生重要作用,其中行动自我效能指个体对自身执行某种行为的信心, 维持自我效能指个体对自身维持某种行为而不中断的信心,恢复自我效能指个体对自身克服挫折、重新恢复中断行为的信心。目前,HAPA模型已被用于分析体力活动、蔬果消费等健康行为的影响因素[4-6],在心血管疾病、呼吸系统疾病患者的自我管理中也有一定研究。在糖尿病领域,HAPA模型主要用于探究2型糖尿病患者体育锻炼行为[7-8]的影响因素,但在饮食行为,尤其在不同膳食模式的形成中缺乏深入研究。由于健康膳食模式的长期坚持是一个涉及动机、意向、计划、形成和维持的阶段性过程,在此期间需要患者自身产生强烈动力[9]。传统的健康行为学理论大多强调知识、动机、态度和行为的养成,缺乏对行为的不同阶段、尤其是从意向到维持过程中一系列认知和态度因素的深入解释,而HAPA模型深入分析了健康行为的阶段性过程及影响因素,因此,应用HAPA模型有助于深入了解2型糖尿病患者饮食管理行为(尤其是膳食模式养成)从动机到维持的决定因素,有利于针对不同膳食模式和饮食管理阶段的患者制定系统的饮食干预策略,从而提高患者的饮食依从性,促进患者养成健康的膳食模式,更好地控制血糖。本研究通过构建结构方程模型,探讨HAPA模型对于2型糖尿病患者膳食模式和血糖控制的影响。
1 资料与方法
1.1 研究对象
本研究的数据为整群随机对照试验的基线数据,选择山东省东营市东城医院下属的11个社区卫生中心,在每个社区内招募所有符合纳入标准的2型糖尿病患者。纳入标准:(1)2型糖尿病患者:空腹血糖≥7.0 mmol/L或口服葡萄糖耐量试验2 h血糖≥11.1 mmol/L或糖化血红蛋白(glycosylated hemoglobin, HbA1c)≥ 6.5%;(2)18~75岁;(3)东营市常住人口;(4)入组前未服用任何精神类药物;(5)会使用智能手机及熟悉一般微信功能;(6)自愿参加研究,填写知情同意书。排除标准:(1)1型糖尿病,妊娠糖尿病,继发糖尿病;(2)合并严重糖尿病并发症;(3)行动不便、神志不清、精神异常者;(4)肿瘤患者;(5)正在参加其他类似研究课题者;(6)不愿合作者。最终纳入2型糖尿病患者819例。
本试验已获得北京大学生物医学伦理委员会审查批准(批准号:IRB00001052-23108),所有的研究对象均自愿参与研究并签署了知情同意书。
1.2 方法
1.2.1 调查工具
通过静脉采血检测研究对象的HbA1c水平。采用一般资料调查表、膳食频率调查问卷、2型糖尿病自我管理量表(the summary of diabetes self-care activities measure, SDSCA)、HAPA量表收集信息,(1)一般资料调查表:自行设计,包括性别、年龄、民族、户籍、文化程度、婚姻状况、家庭人均月收入等内容。(2)膳食频率调查问卷:在既往研究的基础上[10],考虑我国北方人群的膳食特点,结合血糖生成指数(glycemic index, GI)理论,设计了膳食频率调查问卷。该问卷共包含31种食物,其中主食类16种、块茎类3种、蔬菜类2种、水果类4种、肉类3种、饮料类2种、牛奶和乳制品1种。主食进一步分为高GI主食、中低GI主食;蔬菜进一步分为含淀粉类蔬菜、绿色蔬菜;水果进一步分为高GI水果、中低GI水果。通过计算每种食物的日平均摄入量,可以反映研究对象的饮食特点,并可进一步进行膳食模式分析。(3)SDSCA[11]:该量表分为饮食、运动、血糖监测、足部护理四个部分。在饮食部分,每条目按照过去1周遵循饮食管理的天数,设置选项为0~7 d,计为0~7分。总的维度得分为各条目的平均分,得分越高,表明患者的饮食管理情况越好。本研究选择饮食管理部分的总体饮食管理维度进行后续分析,以反映患者对于2型糖尿病饮食管理的依从性。该维度Cronbach’ s α系数为0.960,条目间一致性良好[11]。(4)HAPA量表:基于HAPA模型,结合既往研究自行设计[12-14],量表经过组内讨论、专家咨询后正式使用。该量表用于调查2型糖尿病患者饮食管理的认知情况,分为10维度32条目:感知风险可能性(3条目)、感知风险严重性(2条目)、积极结果预期(3条目)、消极结果预期(3条目)、行为意向(3条目)、行动计划(4条目)、应对计划(3条目)、行动自我效能(3条目)、维持自我效能(5条目)、恢复自我效能(3条目)。该量表总体信效度良好,抽样适合性检验(Kaiser-Meyer-Olkin,KMO)值为0.839,Bartlett球形检验P < 0.001。探索性因子分析结果显示,量表累计方差解释率为76.730%,总Cronbach’ s α系数为0.877,各维度Cronbach’ s α系数均大于0.600,见表 1。该量表采用Likert 5分制计分,各维度得分越高,表明患者的实际情况与该维度越相符。例如,若患者的感知风险可能性得分高,表明患者认为自己的血糖水平容易升高,病情不容易控制;若患者的积极结果预期高,表明患者认可饮食管理对于血糖控制和疾病预后的改善效果, 其他各维度的意义详见表 1。
表1 HAPA量表的维度、定义及Cronbach’ s α系数Table 1 Dimension, definition, and Cronbach' s α of HAPA scale |
| Dimension | Number | Definition | Sample question | Cronbach’s α |
Perceived risk susceptibility | 3 | Awareness of the probability of the occurrence of T2DM-related risk | My blood sugar levels are likely to rise | 0.918 |
| Perceived risk severity | 2 | Awareness of the severity of T2DM-related risk | The aggravation of diabetes will affect my normal life and work | 0.883 |
| Positive outcome expectancies | 3 | Expectation of potential positive outcomes of diet management | Adopting a diabetic diet can make me feel better | 0.801 |
| Negative outcome expectancies | 3 | Expectation of potential negative outcomes of diet management | I waste more energy following a diabetic diet | 0.706 |
| Intention | 3 | Willingness to engage in diet management | I will learn about diabetes diet | 0.769 |
| Action planning | 4 | Planning for when, where, and how to engage in diet management | I know when to eat healthy | 0.892 |
| Coping planning | 3 | Planning for management to address obstacles that may disrupt diet management | I already know what to do if something happens that interferes with my eating plan | 0.942 |
| Action self-efficacy | 3 | Confidence in carrying out diet management | While it took some time to adjust to the new way of eating, I remained confident in sticking to my diet plan | 0.620 |
| Maintenance self-efficacy | 5 | Confidence in addressing obstacles that may disrupt diet management | Even when I’m out, I’m confident I’ll stick to my eating plan | 0.923 |
| Recovery self-efficacy | 3 | Confidence in overcoming setbacks and resuming diet management after failure | I have confidence in sticking to my eating plan when I encounter difficulties (like not having time to buy or cook the right foods) | 0.850 |
HAPA, health action process approach; T2DM, type 2 diabetes mellitus. |
1.2.2 质量控制
所有调查员均经过统一培训,通过问卷星平台(https://www.wjx.cn/)对患者进行一对一、面对面的现场调查。调查数据于当日核查,有问题即时反馈和修改。问卷回收后,由两人背靠背进行逻辑检查和数据筛选。
1.3 统计学分析
问卷数据经问卷星导入至Excel后,使用SPSS 26.0和Mplus 8.3进行统计学分析。符合正态分布的连续变量由均数±标准差表示,不符合正态分布的连续变量由M(P25, P75)表示,分类变量由频数(构成比)表示。采用因子分析确定研究对象的膳食模式。根据特征值是否大于1确定膳食模式的个数,在每个膳食模式中保留因子载荷绝对值≥0.200的食物,以反映该膳食模式的主要特点。采用结构方程模型分析2型糖尿病患者膳食模式和血糖控制的影响因素,纳入的变量包括饮食相关HAPA量表、总体饮食管理情况、膳食模式、血糖水平。检验水准α=0.05。
2 结果
2.1 研究对象的基本特征和血糖水平
本研究共纳入成人2型糖尿病患者819例,基本信息如表 2所示。
表2 2型糖尿病患者的基本特征Table 2 General characteristics of people with type 2 diabetes |
| Items | Population (n = 819) |
| Age/years, ${\bar x}$±s | 64.7±8.2 |
| Gender, n (%) | |
| Male | 444 (54.2) |
| Female | 375 (45.8) |
| Nation, n (%) | |
| Han | 813 (99.3) |
| Minority | 6 (0.7) |
| Residence, n (%) | |
| Urban | 615 (75.1) |
| Rural | 204 (24.9) |
| Education level, n (%) | |
| Junior high school or lower | 382 (46.6) |
| Senior high school or technical secondary school | 265 (32.4) |
| Junior college or higher | 172 (21.0) |
| Marital status, n (%) | |
| Unmarried | 5 (0.6) |
| Married | 745 (91.0) |
| Divorced or bereft of one’s spouse | 69 (8.4) |
| Average household monthly income/yuan, n (%) | |
| ≤1 000 | 85 (10.4) |
| >1 000-≤3 000 | 185 (22.6) |
| >3 000-≤5 000 | 282 (34.4) |
| >5 000 | 267 (32.6) |
| HbA1c/%, ${\bar x}$±s | 7.1±1.1 |
HbA1c, glycosylated hemoglobin. |
2.2 研究对象的总体饮食管理情况
研究对象的总体饮食管理得分为5.0 (1.0, 7.0),其中,患者过去7 d坚持饮食管理天数的得分为5.0 (0.0, 7.0),过去1个月中平均每周坚持饮食管理天数的得分为5.0 (1.0, 7.0)。
2.3 研究对象的膳食模式
通过探索性因子分析对研究对象的膳食模式进行划分。KMO检验和Bartlett球形检验的结果分别为0.654和732.250,相伴概率 < 0.001,表明食物摄入量数据适合进行因子分析。选择特征根≥1的因子个数作为划分的膳食模式类别数,最终获得5个膳食模式类别,共解释了53.504%的总变异。
在5种膳食模式中,保留因子载荷>0.200的食物作为主要食物,并以主要食物对膳食模式进行命名,其中第1种膳食模式的食物主要为中低GI主食、淀粉类蔬菜、绿色蔬菜,因此, 将其命名为中低GI膳食模式;第2种膳食模式的食物主要为红肉类、白肉类,因此, 将其命名为肉类膳食模式;第3种膳食模式的食物主要为中低GI水果和高GI水果,因此, 将其命名为水果膳食模式;第4种膳食模式的食物主要为高GI主食和薯类,因此, 将其命名为高GI/淀粉类膳食模式;第5种膳食模式的食物主要为蛋类、奶类,因此, 将其命名为蛋奶类膳食模式。5种膳食模式的食物成分和因子载荷结果详见表 3。
表3 2型糖尿病患者的膳食模式及主要食物因子载荷Table 3 Dietary patterns and major food factor loadings of people with type 2 diabetes |
| Component | Medium/low GI pattern | Meat pattern | Fruit pattern | High GI and starchy pattern | Egg and milk pattern |
| Low/medium GI staple food | 0.682 | ||||
| High GI staple food | 0.276 | 0.351 | 0.433 | -0.246 | |
| Tubers products | 0.292 | 0.719 | |||
| Starchy vegetables | 0.694 | 0.277 | |||
| Green vegetables | 0.636 | 0.211 | -0.281 | ||
| Low/medium GI fruits | 0.225 | 0.755 | |||
| High GI fruits | 0.782 | ||||
| Red meat | 0.758 | ||||
| White meat | 0.719 | ||||
| Processed meat | 0.645 | ||||
| Eggs | 0.707 | ||||
| Milk products | 0.727 | ||||
| Teas | 0.491 |
GI, glycemic index. |
2.4 研究对象的HAPA量表得分情况
研究对象的HAPA量表得分如表 4所示。
表4 2型糖尿病患者的HAPA得分情况Table 4 HAPA score of people with type 2 diabetes |
| Dimension | Total score | Actual score, M (P25, P75) |
| Perceived risk susceptibility | 15 | 9.0 (6.0, 11.0) |
| Perceived risk severity | 10 | 6.0 (4.0, 8.0) |
| Positive outcome expectancies | 15 | 12.0 (10.0, 13.0) |
| Negative outcome expectancies | 15 | 10.0 (8.0, 12.0) |
| Intention | 15 | 12.0 (10.0, 13.0) |
| Action planning | 20 | 16.0 (12.0, 16.0) |
| Coping planning | 15 | 12.0 (9.0, 13.0) |
| Action self-efficacy | 15 | 10.0 (8.0, 12.0) |
| Maintenance self-efficacy | 25 | 18.0 (14.0, 20.0) |
| Recovery self-efficacy | 15 | 9.0 (7.0, 11.0) |
HAPA, health action process approach. |
2.5 HAPA对2型糖尿病患者膳食模式和血糖控制影响的结构方程模型
根据研究假设,纳入HAPA量表、总体饮食管理、膳食模式和血糖水平,构建结构方程模型,因为性别、年龄等社会人口学特征对膳食模式和血糖水平的影响未观察到差异有统计学意义,因此未纳入到模型中。修正后的模型拟合优度指数为:χ2=1 853.745,χ2/df=2.656,近似残差均根=0.045,标准均方根残差=0.058,比较拟合指标=0.938,Tucker-Lewi指数=0.931,模型拟合程度良好。
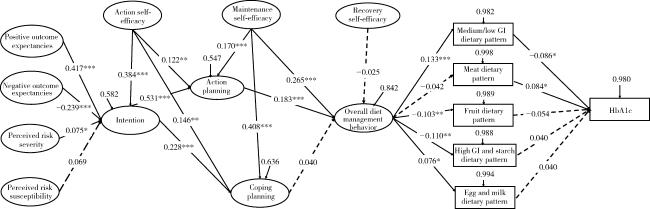
结构方程模型的结果如图 1所示,其中HAPA模型内部结构的结果基本符合研究假设,显示出了结果预期、风险感知、行为意向、计划到饮食管理行为的完整路径,而行动自我效能、维持自我效能和恢复自我效能分别在饮食管理的不同行为阶段起到了积极作用。另外,结果表明总体饮食管理行为对于中低GI膳食模式和蛋奶类膳食模式的养成具有正向影响,对于水果膳食模式和高GI/淀粉类膳食模式的养成具有负向影响,而中低GI膳食模式和肉类膳食模式与HbA1c水平也显示出了进一步的关联。
3 讨论
3.1 2型糖尿病患者的饮食管理依从性和膳食模式现状
此外,本研究利用因子分析探究了2型糖尿病患者的膳食模式,将其分为中低GI膳食模式、肉类膳食模式、水果膳食模式、高GI/淀粉类膳食模式和蛋奶类膳食模式。本研究的结果强调了2型糖尿病患者在主食、肉类、蔬菜水果和蛋奶类食物的选择中具有较为稳定的差异性[17],表明部分患者仍采用传统的饮食模式,以富含碳水化合物、高GI的大米饭、白面条、馒头为主食[18],膳食纤维的摄入量较少[19]。此外,肉类膳食模式、水果膳食模式在2型糖尿病患者的日常饮食中也较为常见[20-21]。由于高GI食物和红肉、加工肉的大量摄入与2型糖尿病的风险增加相关[22-23],因此,针对2型糖尿病患者的膳食现状,应进一步了解膳食模式形成的心理和行为影响因素,对患者进行针对性干预,以促进患者形成健康的膳食模式,提高血糖的控制效果。
3.2 膳食模式对血糖的影响
本研究表明,采用中低GI膳食模式的2型糖尿病患者血糖水平更低,采用肉类膳食模式的2型糖尿病患者血糖水平更高,与既往研究[24]一致,本研究的结果进一步强调了中低GI膳食模式对于2型糖尿病的保护作用。前瞻性观察证据表明,饮食中碳水化合物的相对比例与糖尿病风险关系不明显,但富含纤维、尤其是谷物纤维的饮食,与2型糖尿病风险呈负相关[25]。另外,低GI的膳食模式对于HbA1c水平的改善效果优于低碳饮食[24],因此,以低GI饮食作为2型糖尿病患者饮食管理的目标,可以促进患者实现血糖水平的长期改善。此外,既往研究表明,大量摄入红肉和加工肉类可以升高低密度脂蛋白水平[26],使高血糖、高血脂、肥胖和心血管疾病的风险增加[27-28]。由于我国人群的膳食模式目前逐渐从以大量摄入谷物和膳食纤维为特征的亚洲饮食模式向大量摄入动物性食物、脂肪和低质量碳水化合物的西方饮食模式转变,因此,在2型糖尿病患者的营养教育中,应强调食物摄入种类的多样化、摄入量均衡,教育患者在主食中增加中低GI食物的比例,多食用膳食纤维和优质蛋白,减少红肉和加工肉类的摄入,以更好地降低血糖水平,保持身体健康,而如何在社区层面制定饮食干预,以促使糖尿病患者转变原有的膳食模式,形成并长期坚持有利于血糖控制的膳食模式,是未来糖尿病饮食管理研究中仍需关注的重要问题。
3.3 HAPA模型对于2型糖尿病患者膳食模式的影响
根据HAPA模型,健康行为改变过程可分为动机阶段、意向阶段和行动阶段,其中不同认知因素在各阶段中发挥了重要作用,并最终导致行为的产生和维持[29]。本研究在既往饮食相关HAPA量表的基础上[12-14, 30-31],设计了2型糖尿病饮食管理HAPA量表,问卷信效度良好,可用于了解2型糖尿病患者饮食管理的认知因素。本研究的结果显示,与HAPA模型[30-31]预测相同,2型糖尿病患者膳食模式的形成可分为不同的阶段,其中积极结果预期、消极结果预期、风险严重性等动机因素可以影响饮食管理意向,饮食管理意向可以正向影响行动计划和应对计划,而行动计划和应对计划可以进一步正向影响饮食管理依从性,进而促进中低GI膳食模式和蛋奶类膳食模式的产生和维持,减少肉类、水果类、高GI/淀粉类膳食模式的养成。本研究在既往研究[5, 32]HAPA模型影响健康人群和冠心病人群饮食模式的基础上,以2型糖尿病患者作为研究对象,拓展了HAPA模型在饮食行为领域的解释范围,表明2型糖尿病患者的膳食模式形成是一个多阶段的过程,认知、计划、自我效能分别对不同的行为阶段起作用,其中结果预期是健康膳食前意向阶段的预测因子,计划是弥合饮食意向产生到膳食模式形成的中间因素,自我效能对饮食意向产生、计划制定和健康膳食模式最终形成的三个阶段均有较强的预测作用[33-34]。
既往有干预研究验证了HAPA模型对于青少年、大学生、高血压患者健康膳食行为的促进作用[5, 35-36],基于HAPA模型的健康教育也被证明可以提高2型糖尿病患者的饮食和药物依从性[37],减少碳水化合物的摄入[38]。本研究在既往研究的基础上,将饮食依从性扩展到了膳食模式,表明将HAPA模型作为2型糖尿病饮食管理策略的理论依据具有较高的可行性和有效性。因此,未来的2型糖尿病饮食干预可以根据HAPA模型设计干预措施,例如,对动机阶段的患者,由于积极预期和消极预期均对动机有较强的预测作用,可以从益处、弊端两个方面强化患者对于疾病和健康膳食模式的结果预期,从而引发患者对饮食管理的重视;对于意向阶段的患者,可以通过技能培训、同伴教育等方式辅助其制定健康饮食计划和食谱,鼓励患者形成可持续的长期饮食管理规划;对于行为阶段的患者,可以通过提醒、激励等手段强化患者的自我效能,鼓励其长期坚持饮食管理计划,进而养成良好的膳食模式[7, 38]。饮食管理是一种需要长期坚持的行为,然而,由于需要控制食欲、限制部分食物的摄入,许多患者难以忍受饮食习惯的改变,导致饮食管理依从性不佳[39],难以养成健康的膳食模式。本研究的结果为基于HAPA模型的2型糖尿病饮食干预提供了实证支持,强调了从动机和计划角度采取健康教育的重要性。未来如何减轻患者对于饮食管理的抵触心理,强化其积极结果预期和风险感知,仍是饮食干预的重要研究方向。
此外,本研究的结果表明,自我效能是影响2型糖尿病患者饮食管理动机-意图-行为的重要因素,其中行动自我效能正向影响行为意向[30],可以通过提高患者养成健康膳食模式的信心,促使其制定饮食管理计划,从而养成健康的膳食模式,而行动自我效能和维持自我效能对于行动计划和应对计划具有正向影响,表明当患者对于执行和克服困难具有更高的信心时,更容易制定详细的饮食计划并坚持执行,这在其他健康行为(如体力活动)研究中也得到了体现[40-41]。此外,维持自我效能和恢复自我效能对于饮食管理行为具有正向影响,当患者对克服潜在障碍和行为中断后重新开始具有信心时,更容易长期坚持健康的饮食习惯。在饮食管理中,许多患者表示,放弃自身喜爱的食物非常困难,家庭饮食环境和外出就餐也是影响饮食管理的重要障碍[42],因此,利用HAPA进行2型糖尿病饮食行为干预的重点在于如何对处于不同行为阶段的个体,针对性地提高和发挥其自我效能的作用,激发个体的主动性,从而提高饮食管理的依从水平。
本研究具有一定局限性:(1)这是一项横断面研究,因此,HAPA模型与饮食管理行为的因果关系无法确定;(2)仅选取东营市11个社区卫生中心的2型糖尿病患者作为研究对象,样本异质性较大,结果外推性有限;(3)饮食行为为患者自行报告,存在回忆偏倚,可能无法反映个体的真实状态,而将患者自报的每周饮食依从程度作为饮食管理依从性的测量指标,可能无法完全反映患者实际的糖尿病饮食遵循情况,建议后续研究选择反映患者膳食特征与膳食指南一致程度的指标,可以更直观地显示出患者的饮食依从情况;(4)主要关注了HAPA模型对于膳食模式和血糖控制的影响,性别、年龄等社会人口学特征对于主要结局的影响仍需进一步探讨。