1 资料与方法
1.1 研究对象
1.2 纳入和排除标准
1.3 数据收集
1.4 乳果糖甲烷-氢呼气试验
1.5 统计学方法
2 结果
2.1 无症状HUA患者与健康对照者基本信息及SIBO阳性率比较
表1 无症状HUA患者与健康对照者的基本信息及SIBO阳性率比较Table 1 Comparison of basic information and SIBO positive rate between asymptomatic HUA patients and healthy controls |
| Items | Asymptomatic HUA (n=87) | Healthy control (n=40) | Statistic | P value |
| Gender, n(%) | χ2=0.543 | 0.461 | ||
| Male | 62 (71.26) | 31 (77.50) | ||
| Female | 25 (28.74) | 9 (22.50) | ||
| Age/years, ${\bar x}$±s | 40.11±7.65 | 38.13±8.17 | t=-1.333 | 0.185 |
| BMI/(kg/m2), ${\bar x}$±s | 26.33±2.33 | 24.83±2.61 | t=-1.394 | 0.167 |
| SIBO, n(%) | χ2=16.431 | <0.001 | ||
| Positive | 51 (58.62) | 8 (20.00) | ||
| Negative | 36 (41.38) | 32 (80.00) |
HUA, hyperuricemia; SIBO, small intestinal bacterial overgrowth; BMI, body mass index. |
2.2 无症状HUA患者与健康对照者呼出气体中H2及CH4浓度比较
表2 无症状HUA患者与健康对照者LHBT结果Table 2 LHBT results for asymptomatic HUA patients and healthy controls |
| Items | Asymptomatic HUA (n=87) | Healthy controls (n=40) | Z value | P value |
| H2,M(P25, P75) | ||||
| Baseline | 7.00 (4.00, 12.00) | 5.00 (4.00, 9.00) | -2.100 | 0.036 |
| 30 min | 11.00 (6.00, 15.00) | 6.00 (4.25, 11.50) | -2.676 | 0.007 |
| 60 min | 10.00 (5.00, 16.00) | 5.00 (4.00, 11.25) | -2.910 | 0.004 |
| 90 min | 12.00 (8.00, 24.00) | 8.00 (5.00, 14.00) | -3.049 | 0.002 |
| CH4,M(P25, P75) | ||||
| Baseline | 6.00 (4.00, 9.00) | 6.50 (4.00, 8.00) | -0.329 | 0.742 |
| 30 min | 7.00 (4.00, 9.00) | 7.00 (5.25, 8.00) | -0.089 | 0.929 |
| 60 min | 6.00 (4.00, 10.00) | 6.00 (5.00, 8.00) | -0.723 | 0.470 |
| 90 min | 7.00 (5.00, 12.00) | 7.00 (4.00, 8.00) | -1.714 | 0.086 |
HUA, hyperuricemia; LHBT, lactulose methane-hydrogen breath test. |
2.3 无症状HUA患者与健康对照者炎症因子比较
表3 无症状HUA患者与健康对照者的炎症因子比较Table 3 Comparison of inflammatory factors between asymptomatic HUA patients and healthy controls |
| Items | Asymptomatic HUA (n=87) | Healthy controls (n=40) | Z value | P value |
| CRP/(mg/L),M(P25, P75) | 20.00 (10.00, 33.00) | 5.00 (3.00, 11.00) | -7.596 | <0.001 |
| IL-1β/(ng/L),M(P25, P75) | 4.67 (3.38, 6.62) | 2.03 (1.45, 2.77) | -5.955 | <0.001 |
| IL-6/(ng/L),M(P25, P75) | 3.42 (2.01, 6.07) | 2.46 (1.22, 3.65) | -2.852 | 0.004 |
| TNF-α/(ng/L),M(P25, P75) | 1.21 (0.81, 1.77) | 0.97 (0.61, 1.23) | -2.943 | 0.003 |
HUA, hyperuricemia; CRP, C-reactive protein; IL-1β, interleukin-1β; IL-6, interleukin-6; TNF-α, tumor necrosis factor-α. |
2.4 无症状HUA患者SIBO阳性组与SIBO阴性组临床指标和炎症因子比较
表4 无症状HUA患者SIBO阳性组与SIBO阴性组的临床和实验室指标比较Table 4 Comparison of clinical and laboratory indicators between the SIBO positive and SIBO negative groups of asymptomatic HUA patients |
| Items | SIBO positive group (n=51) | SIBO negative group (n=36) | Statistics | P value |
| Gender | χ2=0.634 | 0.426 | ||
| Male | 38 (74.51) | 24 (66.67) | ||
| Female | 13 (37.25) | 12 (33.33) | ||
| Age/years | 40.98±5.35 | 38.89±10.01 | t=1.144 | 0.258 |
| BMI/(kg/m2) | 26.14±2.20 | 26.60±2.50 | t=-0.917 | 0.362 |
| Laboratory indicators | ||||
| WBC/(×109/L) | 7.12±1.94 | 7.37±2.43 | t=-0.512 | 0.610 |
| HGB/(g/L) | 160.71±13.54 | 158.42±11.65 | t=0.822 | 0.413 |
| PLT/(×109/L) | 239.00±40.74 | 233.83±40.74 | t=0.550 | 0.584 |
| NLR | 2.36 (1.56, 3.40) | 2.11 (1.51, 2.36) | Z=1.896 | 0.058 |
| ALT/(U/L) | 28.45±9.05 | 25.66±6.50 | Z=1.674 | 0.098 |
| AST/(U/L) | 30.35±7.81 | 30.28±13.59 | t=0.033 | 0.976 |
| BUN/(mmol/L) | 5.73±1.10 | 5.51±1.33 | t=0.820 | 0.415 |
| GGT/(mmol/L) | 35.63±15.19 | 38.22±16.28 | t=-0.762 | 0.448 |
| Scr/(μmol/L) | 81.45±17.31 | 78.60±19.24 | t=0.321 | 0.749 |
| UA/(μmol/L) | 507.94±44.72 | 504.25±51.96 | t=0.354 | 0.724 |
| TC/(mmol/L) | 4.74±0.88 | 4.64±0.71 | t=0.571 | 0.570 |
| TG/(mmol/L) | 3.09±0.82 | 4.64±0.71 | t=0.739 | 0.462 |
| HDL-C/(mmol/L) | 1.00±0.32 | 1.08±0.21 | t=-1.601 | 0.113 |
| LDL-C/(mmol/L) | 2.83±0.68 | 2.73±0.63 | t=0.631 | 0.535 |
| CRP/(mg/L) | 24.00 (13.00, 36.00) | 16.50 (7.25, 29.75) | Z=2.069 | 0.039 |
| IL-1β/(ng/L) | 5.23 (3.67, 7.21) | 4.04 (3.04, 5.64) | Z=2.366 | 0.018 |
| IL-6/(ng/L) | 4.54 (3.18, 8.02) | 2.13 (0.97, 3.53) | Z=4.456 | <0.001 |
| TNF-α/(ng/L) | 1.25 (0.88, 1.86) | 1.10 (0.77, 1.74) | Z=1.418 | 0.156 |
Data are expressed as n(%), ${\bar x}$±s or M (P25, P75). HUA, hyperuricemia; SIBO, small intestinal bacterial overgrowth; BMI, body mass index; WBC, white blood cell; HGB, hemoglobin; PLT, platelet; NLR, absolute neutrophil count (ANC)/ absolute lymphocyte count (ALC); ALT, alanine aminotransferase; AST, aspartate aminotransferase; BUN, blood urea nitrogen; GGT, gamma-glutamyl transferase; Scr, serum creatinine; UA, uric acid; TC, total cholesterol; TG, triglycerides; HDL-C, high-density lipoprotein cholesterol; LDL-C, low-density lipoprotein cholesterol; CRP, C-reactive protein; IL-1β, interleukin-1β; IL-6, interleukin-6; TNF-α, tumor necrosis factor-α. |
2.5 无症状HUA患者发生SIBO的影响因素分析
表5 多因素Logistic回归分析无症状HUA患者发生SIBO的影响因素Table 5 Multivariate Logistic regression analysis of the influencing factors of SIBO in asymptomatic HUA patients |
| Items | B | SE | Wald χ2 | P | OR (95%CI) |
| CRP | -0.017 | 0.020 | 0.730 | 0.393 | 0.983 (0.946-1.022) |
| IL-1β | 0.286 | 0.144 | 3.983 | 0.046 | 1.332 (1.005-1.764) |
| IL-6 | 0.461 | 0.136 | 11.549 | 0.001 | 1.586 (1.216-2.069) |
HUA, hyperuricemia; SIBO, small intestinal bacterial overgrowth; CRP, C-reactive protein; IL-1β, interleukin-1β; IL-6, interleukin-6. |
2.6 无症状HUA合并SIBO患者血清炎症因子水平与LHBT集值的相关性分析
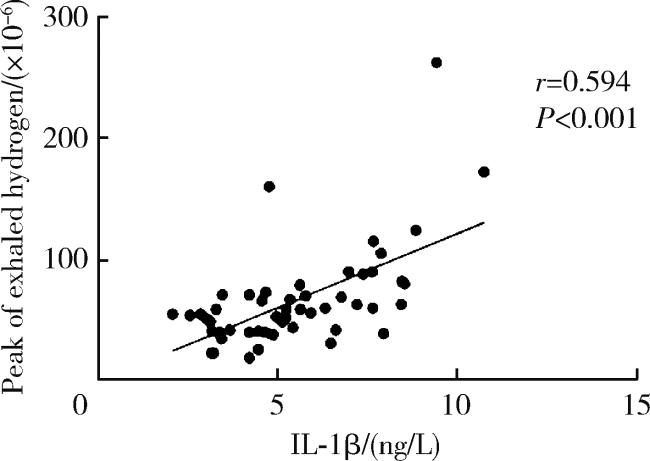
图1 无症状HUA合并SIBO患者LHBT集值与血清IL-1β水平的相关性散点图Figure 1 Scatter plot of the correlation between LHBT values and serum IL-1β levels in asymptomatic HUA patients with SIBO HUA, hyperuricemia; SIBO, small intestinal bacterial overgrowth; LHBT, lactulose methane-hydrogen breath test; IL-1β, interleukin-1β. |