1 资料与方法
1.1 研究现场与对象
1.2 脐带血样本采集与处理
1.3 蛋白质检测与定量
1.4 结局指标的评估
1.5 统计学分析
2 结果
表1 蛋白质组研究人群基线特征分布Table 1 Baseline characteristics of the proteomics study population |
| Characteristics | Total (n=96) | Control (n=54) | Abnormal (n=42) | P | Statistics |
| Age/years,M(P25, P75) | 29.0 (27.0, 31.0) | 28.0 (26.8, 32.0) | 30.0 (27.0, 31.0) | 0.655 | Z=983.00 |
| Age category, n (%) | 0.177 | - | |||
| < 35 years | 82 (89.1) | 44 (84.6) | 38 (95.0) | ||
| ≥35 years | 10 (10.9) | 8 (15.4) | 2 (5.0) | ||
| Parity, n (%) | 0.833 | - | |||
| Nulliparous | 60 (62.5) | 33 (61.1) | 27 (64.3) | ||
| Multiparous | 36 (37.5) | 21 (38.9) | 15 (35.7) | ||
| BMI/(kg/m2), M(P25,P75) | 21.3 (19.7, 23.8) | 21.3 (19.7, 23.6) | 21.3 (19.7, 23.9) | 0.813 | Z =1 048.50 |
| BMI category, n (%) | 0.691 | χ2=0.74 | |||
| < 18.5 kg/m2 | 7 (7.4) | 5 (9.3) | 2 (5.0) | ||
| ≥18.5- < 22.5 kg/m2 | 50 (53.2) | 29 (53.7) | 21 (52.5) | ||
| ≥22.5 kg/m2 | 37 (39.4) | 20 (37.0) | 17 (42.5) | ||
| Education level, n (%) | 0.073 | χ2=5.24 | |||
| High school/technical secondary | 12 (16.4) | 4 (10.0) | 8 (24.2) | ||
| Junior college | 32 (43.8) | 22 (55.0) | 10 (30.3) | ||
| Bachelor’s degree or above | 29 (39.7) | 14 (35.0) | 15 (45.5) | ||
| Annual household income, n (%) | 0.899 | χ2=0.59 | |||
| < 30 000 yuan | 2 (2.2) | 1 (2.0) | 1 (2.5) | ||
| ≥30 000- < 80 000 yuan | 20 (22.0) | 10 (19.6) | 10 (25.0) | ||
| ≥80 000-15 000 yuan | 29 (31.9) | 16 (31.4) | 13 (32.5) | ||
| ≥150 000 yuan | 40 (44.0) | 24 (47.1) | 16 (40.0) | ||
| Infant feeding mode, n (%) | 0.033 | χ2=6.81 | |||
| Artificial feeding | 6 (7.8) | 2 (4.2) | 4 (13.8) | ||
| Exclusive breastfeeding | 60 (77.9) | 42 (87.5) | 18 (62.1) | ||
| Mixed feeding | 11 (14.3) | 4 (8.3) | 7 (24.1) | ||
| Gestational diabetes mellitus, n (%) | 29 (30.2) | 17 (31.5) | 12 (28.6) | 0.825 | - |
| Gestational hypertension, n (%) | 3 (3.1) | 3 (5.6) | 0 (0.0) | 0.254 | - |
| Alcohol consumption, n (%) | 0 (0.00) | 0 (0.00) | 0 (0.00) | >0.999 | χ2=0.00 |
| Smoking and/or passive smoking, n (%) | 35 (36.5) | 16 (29.6) | 19 (45.2) | 0.137 | - |
| Folic acid supplementation, n (%) | 80 (84.2) | 46 (85.2) | 34 (82.9) | 0.783 | - |
| Gestational age at delivery/ weeks | 39.0 (38.0, 40.0) | 39.0 (38.2, 40.0) | 39.0 (38.0, 40.0) | 0.216 | Z =1 296.00 |
| Birth weight/g, ${\bar x}$±s | 3 385.3±376.7 | 3 282.0±274.7 | 3 518.1±446.3 | 0.004 | t=-3.01 |
| Male, n (%) | 45 (46.9) | 22 (40.7) | 23 (54.8) | 0.217 | - |
-, variables analyzed by Fisher’ s exact test have no test statistic. BMI, body mass index. |
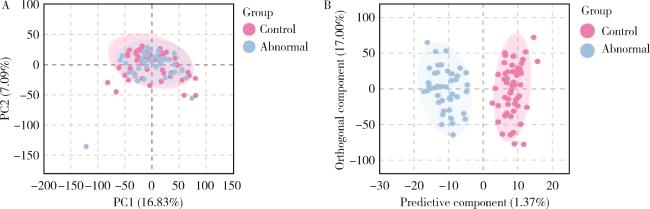
图1 脐带血蛋白质表达谱PCA与OPLS-DA得分图Figure 1 PCA and OPLS-DA score plots of umbilical cord blood protein expression profiles A, PCA score plot of cord blood proteome profiles; B, OPLS-DA score plot of cord blood proteome profiles. Values in parentheses indicate the explained variance. PC1, first principal component; PC2, second principal component; PCA, principal component analysis; OPLS-DA, orthogonal partial least squares discriminant analysis. |
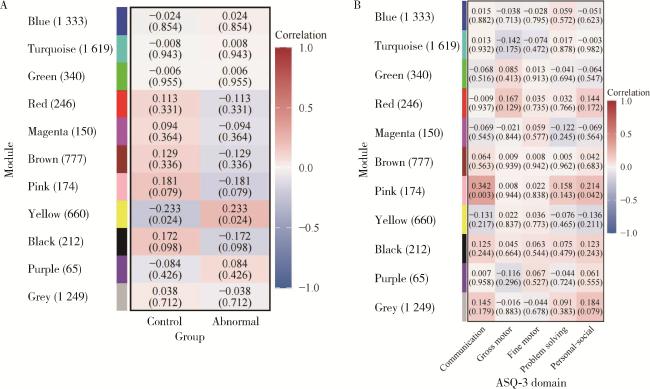
图3 WGCNA蛋白质模块相关性热图Figure 3 Module-trait correlation heatmap of WGCNA protein modules A, correlations between WGCNA gene co-expression modules and group status; B, correlations between modules and ASQ-3 developmental domains. The left labels indicate module names (number of proteins within each module), and the labels within the heatmap represent Pearson correlation coefficients (P values). ASQ-3, ages & stages questionnaires, third edition; WGCNA, weighted gene co-expression network analysis. |
表2 粉色和黄色模块的富集分析Table 2 Enrichment analysis results of significantly associated modules |
| Module | GO biological process | GO molecular function | GO cellular component | KEGG pathway |
| Pink | ||||
| Cortical actin cytoskeleton organization | Spectrin binding | Spectrin-associated cytoskeleton | Mineral absorption | |
| Heme biosynthetic process | Calmodulin binding | Basolateral plasma membrane | Collecting duct acid secretion | |
| Cell cycle | Structural constituent of cytoske- leton | Integral component of plasma membrane | Mitophagy-animal | |
| Cellular iron ion homeostasis | Cytoskeletal anchor activity | Protein kinase CK2 complex | Porphyrin metabolism | |
| Iron ion homeostasis | Proton-transporting ATPase activity, rotational mechanism | Cell junction | Wnt signaling pathway | |
| Yellow | ||||
| Translation | Structural constituent of ribosome | Nucleolus | Ribosome | |
| mRNA splicing (via spliceosome) | DNA binding | Nuclear speck | Spliceosome | |
| mRNA processing | mRNA binding | Focal adhesion | COVID-19 | |
| Cytoplasmic translation | Chromatin binding | Endoplasmic reticulum | Neutrophil extracellular trap formation | |
| RNA splicing | Zinc ion binding | Cytosolic large ribosomal subunit | mRNA surveillance pathway |
Ranked by FDR. All enrichment results are significant at FDR < 0.05. GO, gene ontology; KEGG, Kyoto encyclopedia of genes and genomes; ATPase, adenosine triphosphatase; CK2, casein kinase 2; mRNA, messenger ribonucleic acid; DNA, deoxyribonucleic acid; RNA, ribonucleic acid; COVID-19, coronavirus disease-2019; FDR, false discovery rate. |
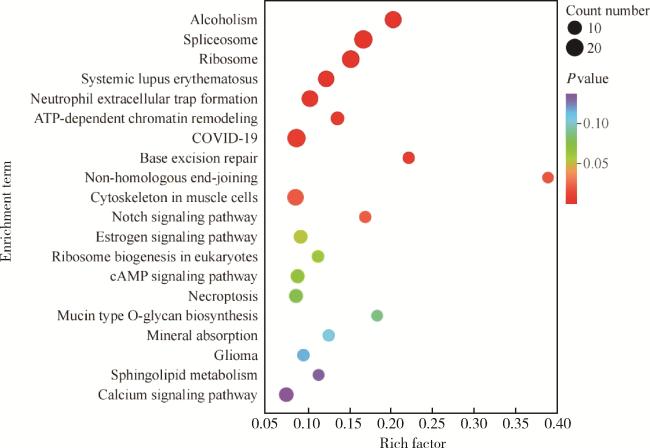
图4 差异表达蛋白质KEGG通路富集分析气泡图Figure 4 Bubble plot of KEGG pathway enrichment analysis for differentially expressed proteins Rich factor=(differential proteins in pathway/total differential proteins) ÷ (background proteins in pathway/total background proteins). ATP, adenosine triphosphate; COVID-19, coronavirus disease-2019; cAMP, cyclic adenosine monophosphate; KEGG, Kyoto encyclopedia of genes and genomes. |
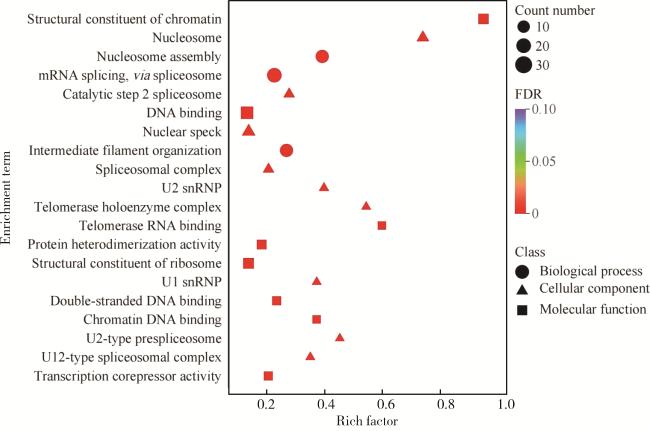
图5 差异表达蛋白质GO通路富集分析气泡图Figure 5 Bubble plot of GO pathway enrichment analysis for differentially expressed proteins mRNA, messenger ribonucleic acid; DNA, deoxyribonucleic acid; snRNP, small nuclear ribonucleoprotein; RNA, ribonucleic acid; FDR, false discovery rate; GO, gene ontology. |