1 资料与方法
1.1 研究对象
1.2 暴露因素
1.3 结局事件
1.4 统计学分析
2 结果
2.1 队列人群的基线特征和结局事件
表1 研究对象的基线特征Table 1 Baseline characteristics of study participants |
| Characteristics | Total (n=226 406) | Men (n=105 848) | Women (n=120 558) | P value |
| Age/years, $\bar x \pm s$ | 55.0±9.3 | 55.5±9.9 | 54.5±9.9 | < 0.001 |
| Region (urban), n(%) | 154 444 (68.2) | 73 345 (69.3) | 81 099 (67.3) | < 0.001 |
| Education (senior high school or higher), n(%) | 34 238 (15.1) | 19 442 (18.4) | 14 796 (12.3) | < 0.001 |
| Smoker, n(%) | 41 861 (18.5) | 40 238 (38.0) | 1 623 (1.3) | < 0.001 |
| Hypertension, n(%) | 74 319 (32.8) | 35 014 (33.1) | 39 305 (32.6) | 0.016 |
| Diabetes, n(%) | 19 701 (8.7) | 9 226 (8.7) | 10 475 (8.7) | 0.823 |
| SBP/mmHg, $\bar x \pm s$ | 131.2±16.3 | 131.9±15.9 | 130.6±16.7 | < 0.001 |
| DBP/mmHg, $\bar x \pm s$ | 81.6±9.6 | 82.5±9.5 | 80.8±9.6 | < 0.001 |
| BMI/(kg/m2), $\bar x \pm s$ | 23.3±2.8 | 23.3±2.7 | 23.2±2.9 | < 0.001 |
| TG/(mg/dL), M (IQR) | 145.5 (111.5, 179.1) | 141.6 (106.4, 172.8) | 151.2 (116.4, 185.7) | < 0.001 |
| TC/(mg/dL), $\bar x \pm s$ | 190.2±37.8 | 185.6±37.3 | 194.3±37.7 | 0.030 |
| HDL-C/(mg/dL), $\bar x \pm s$ | 50.3±12.9 | 48.5±13.1 | 52.0±12.4 | < 0.001 |
| LDL-C/(mg/dL), $\bar x \pm s$ | 109.7±31.0 | 111.5±31.3 | 107.2±30.6 | < 0.001 |
| GLU/(mmol/L), M (IQR) | 5.3 (4.9, 5.9) | 5.4 (5.0, 6.0) | 5.3 (4.9, 5.8) | < 0.001 |
| Creatinine/(mg/dL), $\bar x \pm s$ | 0.7±0.2 | 0.8±0.2 | 0.7±0.2 | < 0.001 |
| hs-CRP/(mg/dL), M (IQR) | 0.6 (0.3, 1.7) | 0.7 (0.3, 1.8) | 0.6 (0.2, 1.7) | < 0.001 |
| Light BioAge, M (IQR) | 49.3 (40.3, 58.9) | 50.9 (41.7, 60.6) | 47.9 (39.0, 57.4) | < 0.001 |
| AgeDiff, $\bar x \pm s$ | -5.1±8.3 | -4.1±8.4 | -6.0±8.3 | < 0.001 |
SBP, systolic blood pressure; DBP, diastolic blood pressure; BMI, body mass index; TG, triglyceride; TC, total cholesterol; HDL-C, high-density lipoprotein cholesterol; LDL-C, low-density lipoprotein cholesterol; GLU, serum glucose; hs-CRP, hypersensitive C-reactive protein; Light BioAge, the light version of biological age; AgeDiff, age difference on Light BioAge and chronological age; IQR, interquartile range. |
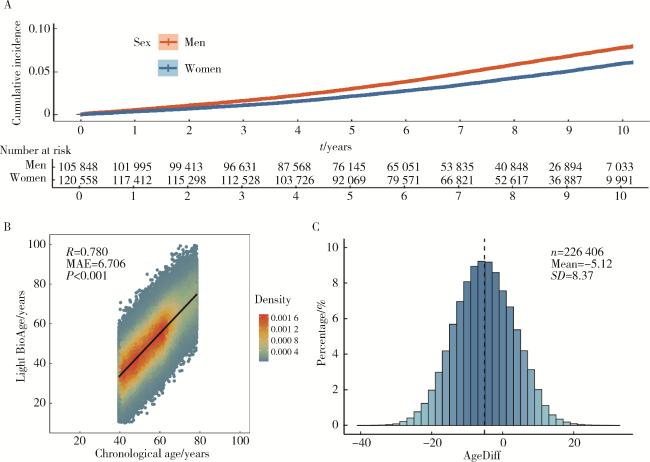
图1 研究人群的心血管病发病和死亡复合结局与简易生物学年龄的分布情况Figure 1 Distribution of cardiovascular composite outcome and Light BioAge of study participants A, Kaplan-Meier curve of cardiovascular composite outcome by sex; B, correlations of Light BioAge with chronological age; C, the distribution of age difference on Light BioAge and chronological age(AgeDiff). MAE, mean absolute error; SD, standard deviation. |
2.2 Light BioAge模型预测全因死亡区分度的验证
2.3 不同性别亚组中的年龄差值与心血管病结局事件的关联
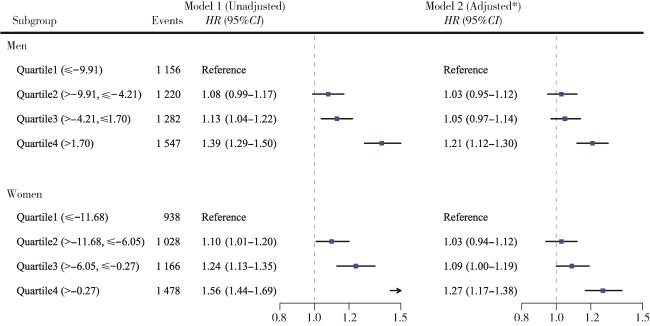
图2 不同性别人群生物学年龄差值与心血管病结局事件的关联Figure 2 Association of age difference on Light BioAge and chronological age with cardiovascular composite outcome, by sex *Adjusted for chronological age, education, region, smoking status, body mass index, systolic blood pressure, total cholesterol, and high-density lipoprotein cholesterol. HR, hazard ratio; CI, confidence interval. |
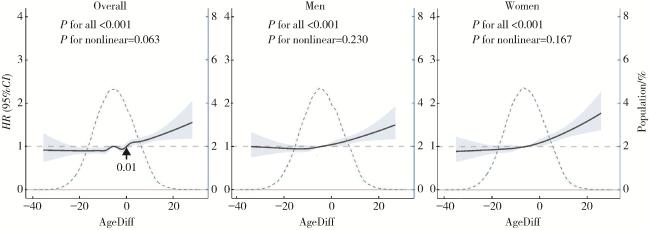
图3 按性别分组的生物学年龄差值与心血管病结局事件的非线性关联Figure 3 Nonlinear association of age difference on Light BioAge and chronological age with cardiovascular composite outcome, by sex P for all tested whether using splines improves the model compared to a simple linear term; P for nonlinear tested whether the nonlinear part of the spline model is statistically significant. Graphs show multivariate adjusted HR (solid lines) and 95%CI (shaded areas). Dashed lines represent the proportion of the population with different levels of age difference (AgeDiff) on Light BioAge and chronological age. Arrows indicate the age difference at the point where risk crosses the line (HR=1). Analyses used variables in the Model 2 (adjusted for chronological age, education, region, smoking status, body mass index, systolic blood pressure, total cholesterol, and high-density lipoprotein cholesterol). HR, hazard ratio; CI, confidence interval. |
2.4 生物学年龄对心血管病风险预测性能的影响
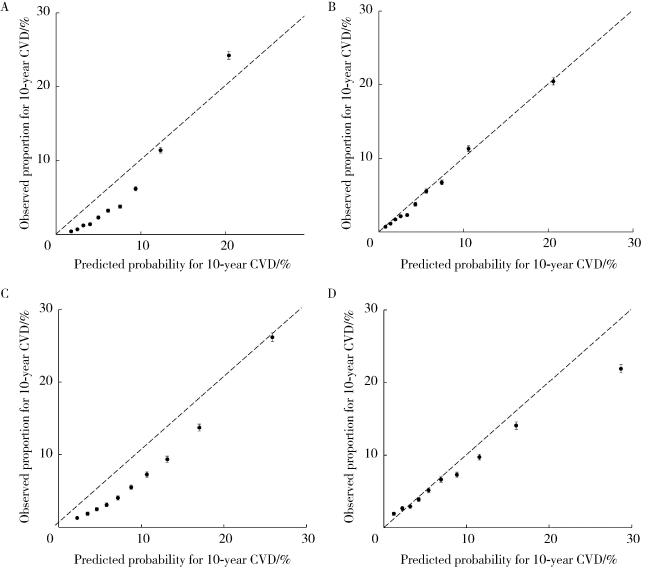
图4 基于时序年龄与生物学年龄的WHO心血管病风险预测模型校准图Figure 4 Calibration plots of the WHO cardiovascular risk models using chronological age or Light BioAge A, WHO model by chronological age (women); B, WHO model by Light BioAge (women); C, WHO model by chronological age (men); D, WHO model by Light BioAge (men). WHO, World Health Organization; CVD, cardiovascular disease. |