1 资料与方法
1.1 研究对象
1.2 资料收集与协变量定义
1.3 高血糖的评估标准
1.4 结局定义与随访
1.5 统计学分析
2 结果
2.1 患者基本特征
表1 按围术期血糖状态分层的ESCC根治术患者基线特征Table 1 Selected characteristics of ESCC patients who underwent radical esophagectomy, stratified by perioperative glucose status |
| Characteristics | Total(n=5 952) | Preoperative hyperglycemiaa | Postoperative hyperglycemiaa | |||||
| No (n=5 341) | Yes (n=381) | P valueb | No (n=3 796) | Yes (n=848) | P valueb | |||
| Age/years | 63.0 (58.0, 68.0) | 63.0 (58.0, 68.0) | 64.0 (60.0, 68.0) | 0.018 | 64.0 (59.0, 68.0) | 65.0 (60.5, 70.0) | < 0.001 | |
| Gender | < 0.001 | < 0.001 | ||||||
| Male | 3 840 (64.5) | 3 482 (94.6) | 197 (5.4) | 2 515 (85.3) | 433 (14.7) | |||
| Female | 2 112 (35.5) | 1 859 (91.0) | 184 (9.0) | 1 281 (75.5) | 415 (24.5) | |||
| Smokingc | < 0.001 | < 0.001 | ||||||
| No | 2 719 (46.8) | 2 385 (91.4) | 224 (8.6) | 1 710 (77.3) | 503 (22.7) | |||
| Yes | 3 086 (53.2) | 2 827 (95.2) | 144 (4.8) | 1 978 (86.1) | 320 (13.9) | |||
| Drinkingc | 0.042 | < 0.001 | ||||||
| No | 3 762 (65.5) | 3 349 (92.9) | 257 (7.1) | 2 386 (80.2) | 589 (19.8) | |||
| Yes | 1 980 (34.5) | 1 805 (94.3) | 109 (5.7) | 1 253 (84.8) | 224 (15.2) | |||
| BMI/(kg/m2)c | < 0.001 | < 0.001 | ||||||
| < 24.0 | 3 337 (70.0) | 3 068 (95.2) | 153 (4.8) | 2 050 (85.0) | 361 (15.0) | |||
| ≥ 24.0 | 1 431 (30.0) | 1 224 (89.6) | 142 (10.4) | 900 (76.4) | 278 (23.6) | |||
| pStageb | 0.822 | 0.102 | ||||||
| 0 andⅠ | 1 356 (22.9) | 1 206 (93.1) | 89 (6.9) | 910 (79.6) | 233 (20.4) | |||
| Ⅱ | 2 401 (40.6) | 2 162 (93.6) | 149 (6.4) | 1 592 (82.1) | 347 (17.9) | |||
| Ⅲ | 2 157 (36.5) | 1 939 (93.1) | 143 (6.9) | 1 267 (82.7) | 265 (17.3) | |||
| Center | 0.021 | 0.065 | ||||||
| Northern | 4 001 (67.2) | 3 562 (92.8) | 276 (7.2) | 2 891 (81.2) | 671 (18.8) | |||
| Southern | 1 951 (32.8) | 1 779 (94.4) | 105 (5.6) | 905 (83.6) | 177 (16.4) | |||
Data are M (P25, P75) or n(%). BMI, body mass index; ESCC, esophageal squamous cell carcinoma; pStage, pathological stage. a, due to missing preoperative or postoperative glucose measurements in some patients, the sum of cases across groups does not equal the total sample size; b, categorical variables were compared using the Chi-square test, and continuous variables were compared using the Student’ s t test; c, the sum of the number of patients in different categories is not equal to the total sample size because of the existence of missing values. |
2.2 长期生存结局
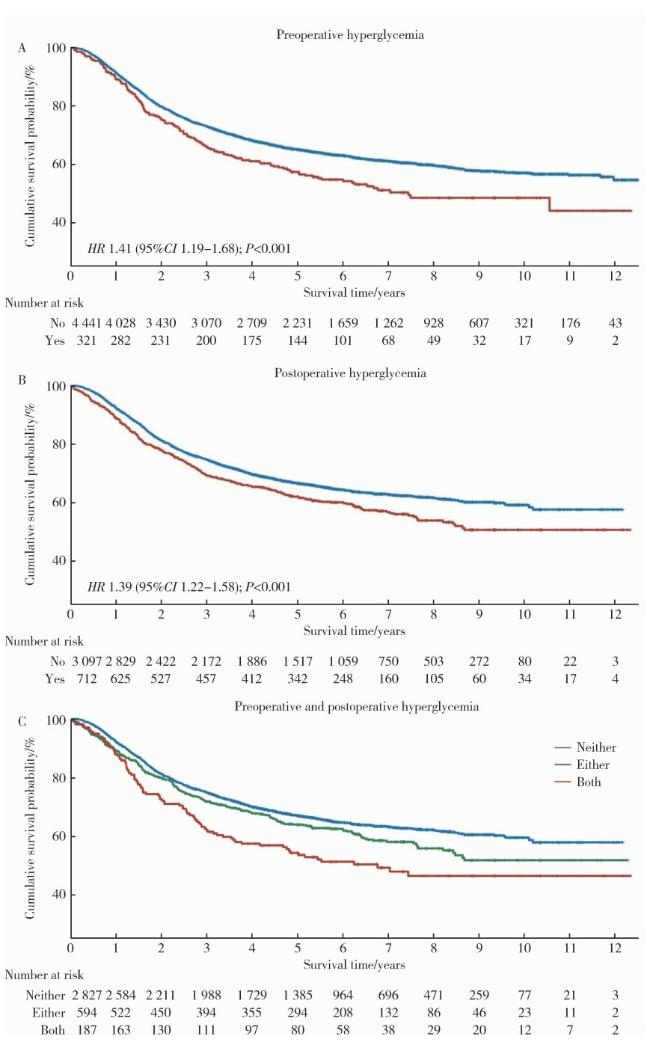
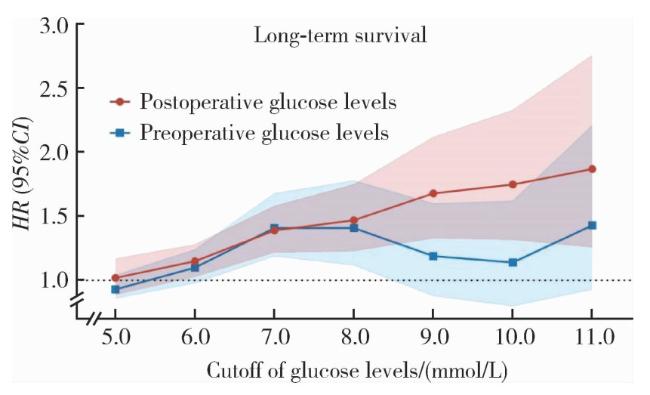
图2 不同血糖临界值定义的围术期高血糖与ESCC根治术患者总生存期的关联Figure 2 Association of high perioperative glucose levels, defined using different cutoffs, with long-term OS of ESCC patients who underwent radical esophagectomy Different cutoffs of glucose levels (from 5.0 to 11.0 mmol/L with an increment of 1.0 mmol/L) were used to divide patients into high and low-to-normal levels of blood glucose concentrations. HR and 95% CI representing the survival effect of high postoperative (red lines) and preoperative (blue lines) glucose levels as compared with low-to-normal glucose levels were obtained using multivariable Cox proportional-hazard models adjusting for age, gender, smoking, alcohol consumption, body mass index, presence of comorbidities, tumor location, tumor morphology, pathological tumor-lymph node-metastasis (pTNM) stage, tumor grade, tumor size, number of lymph nodes harvested, surgical margin status, calendar year of operation, and center. CI, confidence interval; ESCC, esophageal squamous cell carcinoma; HR, hazard ratio; OS, overall survival. |
表2 围术期血糖水平与ESCC根治术患者长期总生存的剂量-反应关系Table 2 Dose-response relationship of perioperative glucose levels with long-term OS among ESCC patients who underwent radical esophagectomy |
| Glucose levels/(mmol/L) | Total,n (%) | Death,n (%) | 5-year survival/% (95%CI) | Adjusted HR (95%CI)a | P valuea |
| Preoperative | |||||
| < 7.0 | 4 441 (93.3) | 1 667 (37.5) | 66.5 (64.8-68.1) | Reference | |
| 7.0- < 11.0 | 271 (5.7) | 126 (46.5) | 56.7 (51.0-63.2) | 1.40 (1.17-1.69) | < 0.001 |
| ≥ 11.0 | 50 (1.1) | 21 (42.0) | 60.6 (48.3-76.2) | 1.47 (0.95-2.27) | 0.081 |
| Ptrend | < 0.001 | ||||
| Postoperative | |||||
| < 7.0 | 3 097 (81.3) | 1 086 (35.1) | 66.4 (64.7-68.2) | Reference | |
| 7.0- < 11.0 | 668 (17.5) | 267 (40.0) | 63.0 (59.3-66.9) | 1.35 (1.18-1.55) | < 0.001 |
| ≥ 11.0 | 44 (1.2) | 26 (59.1) | 43.4 (30.5-61.7) | 1.98 (1.34-2.94) | 0.001 |
| Ptrend | < 0.001 |
CI, confidence interval; ESCC, esophageal squamous cell carcinoma; HR, hazard ratio; OS, overall survival. a, HR, 95% CI and P values were obtained using multivariable Cox proportional-hazard models, adjusting for age, gender, smoking, alcohol consumption, body mass index, presence of comorbidities, tumor location, tumor morphology, pathological tumor-lymph node-metastasis (pTNM) stage, tumor grade, tumor size, margin status, postoperative treatment modality, calendar year of operation, and study center. To evaluate trends in HR, ordinal variables were modeled as single, continuous variables. |
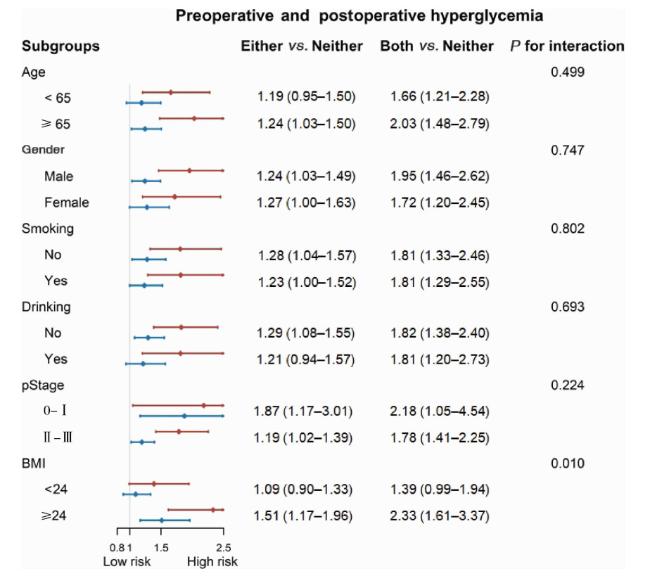
图3 围术期血糖水平与ESCC根治术患者总生存期关联的分层分析Figure 3 Subgroup analysis of the associations between perioperative glucose levels and long-term OS among ESCC patients who underwent radical esophagectomy HR and 95% CI were obtained using multivariable Cox proportional-hazard models, adjusting for age, sex, smoking, alcohol consumption, body mass index (BMI), presence of comorbidities, tumor location, tumor morphology, pathological tumor-lymph node-metastasis (pTNM) stage, tumor grade, tumor size, margin status, postoperative treatment modality, calendar year of operation, and study center. The multiplicative interaction between hyperglycemia and each one of the stratified factors was evaluated by including an interaction term in the multivariable Cox proportional-hazard regression model. Both preoperative and postoperative hyperglycemia were defined as mean glucose levels ≥ 7.0 mmol/L (126 mg/dL). Perioperative glucose status was categorized as "Neither" (with no hyperglycemia), "Either" (with preoperative or postoperative hyperglycemia alone), and "Both" (with both preoperative and postoperative hyperglycemia). CI, confidence interval; ESCC, esophageal squamous cell carcinoma; HR, hazard ratio; OS, overall survival. |