1 材料与方法
1.1 实验材料
1.1.1 实验动物
1.1.2 试剂
1.1.3 仪器与耗材
1.2 组织解离与原代CFs提取方法的构建
1.3 用免疫荧光法鉴定CFs的纯度
1.4 细胞增殖检测
1.5 RNA提取、逆转录和qPCR
表1 qPCR引物序列Table 1 Sequences of the primers for qPCR |
| Name | Primer sequence (5′-3′) |
| GAPDH | Forward: AGGTCGGTGTGAACGGATTTG Reverse: TGTAGACCATGTAGTTGAGGTCAA |
| α-SMA | Forward: CTTCCAGCCATCTTTCATTGG Reverse: GTTCTGGAGGGGCAATGAT |
| ColⅠ | Forward: CCTCAGGGTATTGCTGGACAAC Reverse: CAGAAGGACCTTGTTTGCCAGG |
| FN | Forward: CCGGTGGCTGTCAGTCAGA Reverse: CCGTTCCCACTGCTGATTTATC |
qPCR, quantitative real-time PCR; α-SMA, α-smooth muscle actin; ColⅠ, collagen typeⅠ; FN, fibronectin. |
1.6 Western blot
1.7 统计学分析
2 结果
2.1 胶原酶Ⅱ/Ⅳ、胰蛋白酶和DNaseⅠ提取成年小鼠CFs
表2 胶原酶Ⅱ与胶原酶Ⅳ联合消化酶的配伍条件Table 2 Formulation conditions for collagenase Ⅱ and Ⅳ combination |
| Enzyme concentrations | Collagenase Ⅱ group | Collagenase Ⅳ group |
| Collagenase Ⅱ/(g/L) | 1.2 | - |
| Collagenase Ⅳ/(g/L) | - | 1.2 |
| Trypsin/(g/L) | 0.8 | 0.8 |
| DNaseⅠ/(g/L) | 0.2 | 0.2 |
| Red blood cell lysis | + | + |
表3 胶原酶Ⅱ与胶原酶Ⅳ联合消化法的效果比较Table 3 Combined collagenase Ⅱ and Ⅳ digestion efficacy comparison |
| Group | Digestion time/min | Cell yield (cell number/field), median (minimum, maximum) |
| Collagenase Ⅱ | 22 | 479 (419, 653) |
| Collagenase Ⅳ | 22 | 474 (435, 669) |
表4 不同组别的处理条件Table 4 Treatment conditions for different groups |
| Enzyme concentrations | Optimized group | No collagenase group | No trypsin group | No DNaseⅠ group | No red blood cell lysis group |
| Collagenase Ⅱ/(g/L) | 1.2 | - | 1.2 | 1.2 | 1.2 |
| Trypsin/(g/L) | 0.8 | 0.8 | - | 0.8 | 0.8 |
| DNaseⅠ/(g/L) | 0.2 | 0.2 | 0.2 | - | 0.2 |
| Red blood cell lysis | + | + | + | + | - |
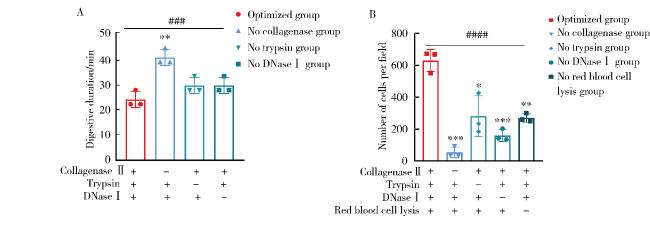
图1 各组消化用时和细胞得率(细胞数/视野)的比较Figure 1 Comparison of digestion time and cell yield (cell number/field) A, comparison of digestion time among multiple treatment groups (n=3); B, quantification of viable cells isolated using different methods following 72-hour culture (n=3). * P < 0.05, * * P < 0.01, * * * P < 0.001, optimized group vs. other groups; ### P < 0.001, #### P < 0.000 1, multiple comparisons. |
2.2 酶浓度对消化时长和细胞得率的影响
表5 各组消化酶浓度及处理条件Table 5 Concentration of digestive enzymes and treatment condition in each group |
| Enzyme concentrations | Optimized group | 0.5×concentration group | 2×concentration group |
| Collagenase Ⅱ/(g/L) | 1.2 | 0.6 | 2.4 |
| Trypsin/(g/L) | 0.8 | 0.4 | 1.6 |
| DNaseⅠ/(g/L) | 0.2 | 0.1 | 0.4 |
| Red blood cell lysis | + | + | + |
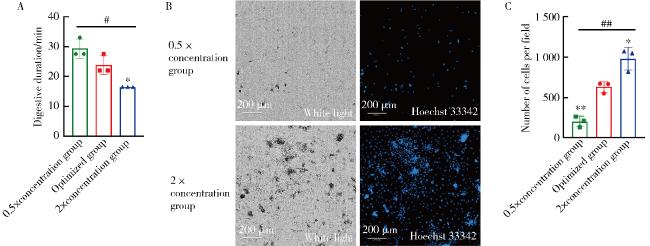
图2 优化组、0.5×浓度组和2×浓度组消化用时和细胞得率(细胞数/视野)的比较Figure 2 Comparison of digestion time and cell yield (cell number/field) among the optimized group, 0.5× and 2× enzyme concentration group A, comparison of digestion time among the optimized group, 0.5× and 2× enzyme concentration group (n=3); B and C, after incubation for 72 h, the cells were photographed and analyzed by Operetta CLS High Content Imaging Analysis System (×10), and the number of cells in each field was counted (n=3). * P < 0.05, * * P < 0.01, optimized group vs. other groups; # P < 0.05, ## P < 0.01, multiple comparisons. |
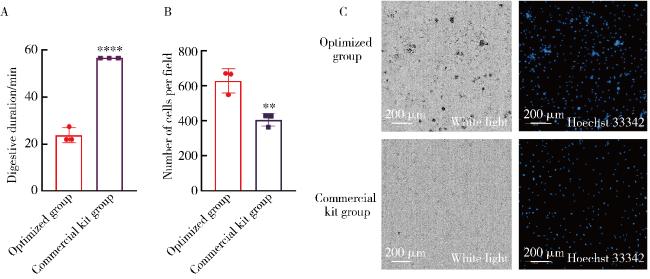
图3 优化组与试剂盒组消化时长和细胞得率(细胞数/视野)的比较Figure 3 Comparison of digestion time and cell yield (cell number/field) between the optimized group and commercial kit group A, comparison of digestion time between the optimized group and the commercial kit group (n=3, * * * * P < 0.000 1); B, after 72 h of incubation, the cell yield of the optimized group and the commercial kit group was analyzed (n=3, * * P < 0.01); C, the obtained cells were photographed and analyzed by Operetta CLS High Content Imaging Analysis System (×10). |
2.3 优化组酶解方案的消化时间和细胞得率
2.4 优化组酶解方案获得的CFs纯度
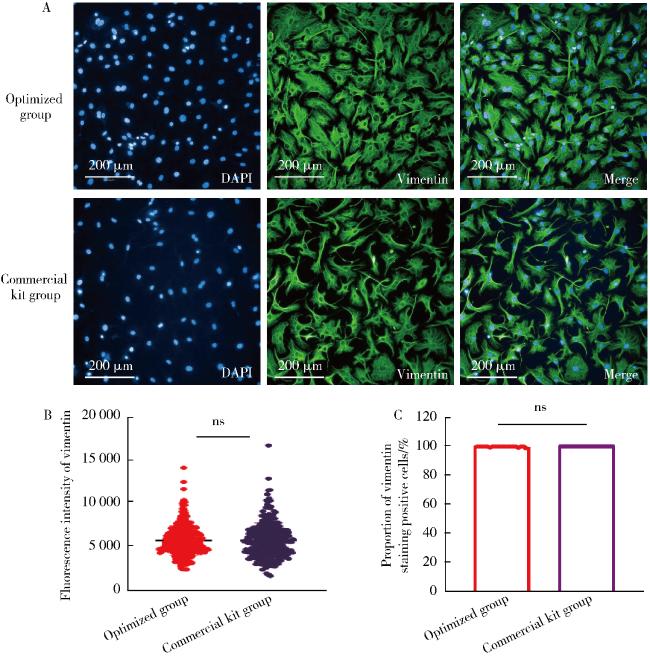
图4 优化组与试剂盒组提取CFs的纯度比较Figure 4 Comparison of CFs purity between the optimized group and the commercial kit group A, immunofluorescence analysis of vimentin expression in CFs. Vimentin protein levels in CFs were assessed by immunofluorescence staining, with representative images captured using a high-content screening (HCS) system at 20× magnification. B, quantitative comparison of vimentin fluorescence intensity. Randomly selected microscopic fields (n=20 per group) with comparable cellular densities were subjected to HCS-based fluorescence quantification. No statistically significant intergroup differences were observed in vimentin intensity profiles (P>0.05). C, threshold-based vimentin-positive cell analysis. The percentage of DAPI (+) nuclei exhibiting vimentin fluorescence intensities exceeding 2 000 was calculated for each field. This threshold analysis revealed comparable proportions of vimentin (+) cells between experimental groups (P>0.05). CFs, cardiac fibroblasts; ns, no significance. |
2.5 TGF-β1刺激实验检测优化组提取的CFs分化潜能
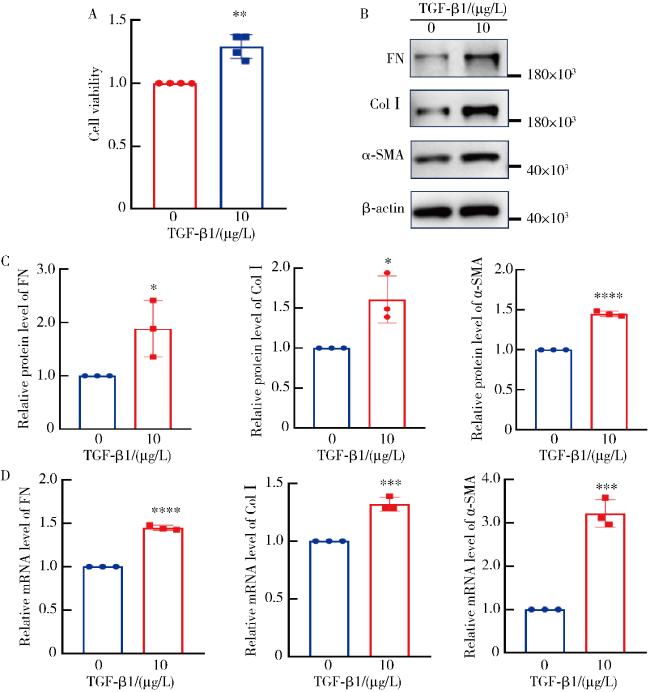
图5 TGF-β1处理后CFs转分化能力的评估Figure 5 Evaluation of the trans-differentiation ability of CFs after TGF-β1 treatment A, after stimulation with TGF-β1, the viability of P1 generation CFs was evaluated through the CCK-8 assay (n=4); B and C, the protein expression levels of ColⅠ, α-SMA and FN were analyzed by Western blotting; D, the mRNA levels of ColⅠ, α-SMA and FN were detected by qPCR (n=3). * P < 0.05, * * P < 0.01, * * * P < 0.001, * * * * P < 0.000 1. CFs, cardiac fibroblasts; TGF-β1, transforming growth factor β1; α-SMA, α-smooth muscle actin; ColⅠ, collagen typeⅠ; FN, fibronectin; qPCR, quantitative real-time PCR. |