1 资料与方法
1.1 研究对象
1.2 RNA测序和数据处理
1.3 预后模型的构建
1.4 模型评估和验证
1.5 敏感性分析
1.6 生物学功能分析
1.7 统计学分析
2 结果
2.1 UROMOL队列和中国验证队列的基线特征
表1 训练队列和验证队列患者基线特征的比较Table 1 Comparison of baseline clinical characteristics between the training and validation cohorts |
| Variables | Training cohort (n=535) | Validation cohort (n=85) | P |
| Age/years | 69 (62.0-76.0) | 67 (60.0-74.0) | 0.065 |
| Sex | 0.541 | ||
| Male | 414 (77.4) | 66 (77.6) | |
| Female | 121 (22.6) | 19 (22.4) | |
| T stage | < 0.001 | ||
| CIS | 3 (0.6) | 1 (1.2) | |
| Ta | 135 (25.2) | 61 (71.8) | |
| T1 | 397 (74.2) | 23 (27.1) | |
| Tumor grade | 0.881 | ||
| PUNLMP | 0 (0) | 11 (12.9) | |
| Low grade | 320 (59.8) | 34 (40.0) | |
| High grade | 215 (40.2) | 40 (47.1) | |
| EORTC risk group | 0.003 | ||
| Low risk | 324 (60.6) | 54 (63.5) | |
| Intermediate risk | 0 (0) | 31 (36.5) | |
| High risk | 211 (39.4) | 0 (0) |
Data are presented as median (interquartile range) or n(%). CIS, carcinoma in situ; PUNLMP, papillary urothelial neoplasm of low malignant potential; EORTC, European Organization for Research and Treatment of Cancer. |
2.2 36基因模型的构建与评估
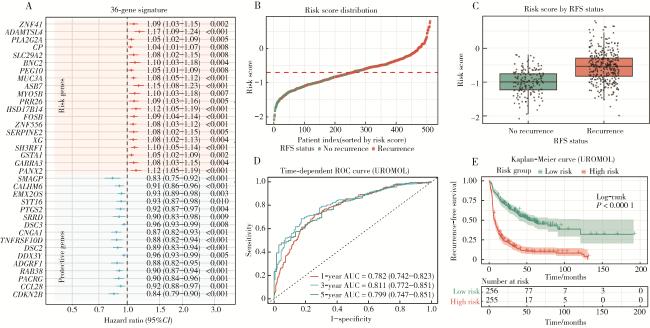
图1 训练队列中36基因模型的构建与性能评估Figure 1 Construction and performance evaluation of the 36-gene signature A, forest plot of univariate Cox regression results for the 36 selected genes; B, RNA risk score distribution in the training cohort; C, comparison of risk scores between recurrent and non-recurrent patients; D, time-dependent ROC curves for 1-, 3-, and 5-year RFS prediction; E, Kaplan-Meier RFS curves for low-risk (green) and high-risk (red) groups based on the median cutoff. ROC, receiver operating characteristic; AUC, area under curve; RFS, recurrence-free survival; UROMOL, Urothelial Cancer Molecular Classification Consortium. |
2.3 模型的内部和外部验证
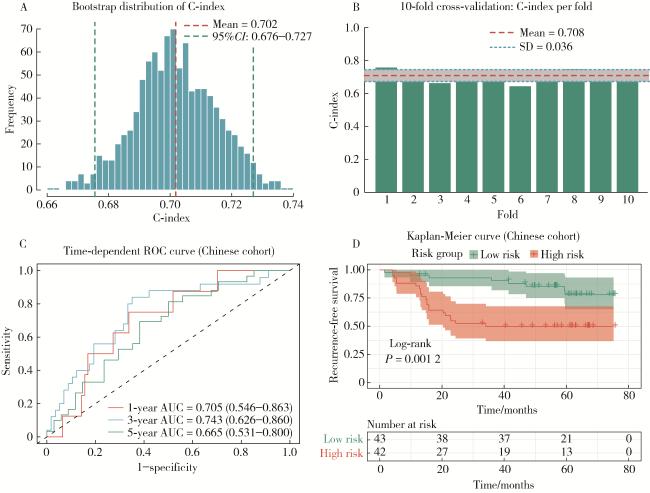
图2 模型内部验证及独立中国队列的外部验证Figure 2 Internal validation and external validation of the model in an independent Chinese cohort A, Bootstrap distribution of concordance index (C-index) from 1 000 resamples; B, bar plot of C-index across 10-fold cross-validation; C, time-dependent ROC curves for 1-, 3-, and 5-year RFS prediction in the independent Chinese validation cohort; D, Kaplan-Meier RFS curves for low-risk (green) and high-risk (red) groups in the validation cohort. SD, standard deviation; Other abbreviations as in Figure 1. |
2.4 36基因模型与EORTC评分在中国患者中的预测效能比较
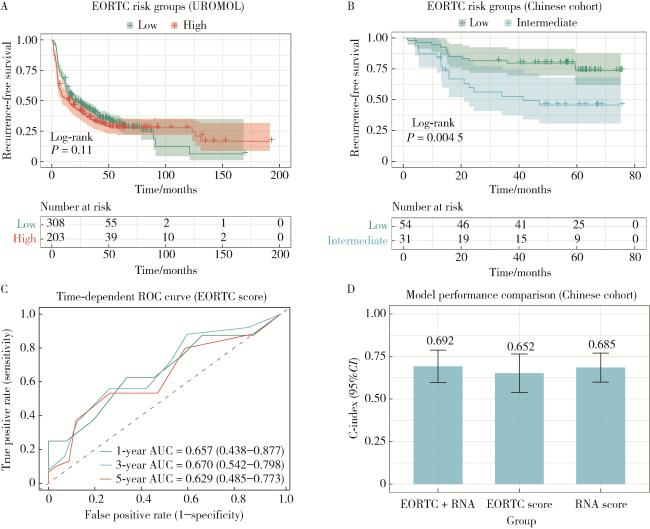
图3 36基因模型与EORTC评分预测性能的比较Figure 3 Predictive efficacy in the 36-gene signature and EORTC score A, Kaplan-Meier RFS curves according to EORTC risk groups in the training cohort; B, Kaplan-Meier RFS curves according to EORTC risk groups in the validation cohort; C, time-dependent ROC curves for the EORTC score in the validation cohort; D, performance comparison across three models in the validation cohort. EORTC, European Organization for Research and Treatment of Cancer; C-index, concordance index; Other abbreviations as in Figure 1. |
2.5 36基因模型的生物学特征
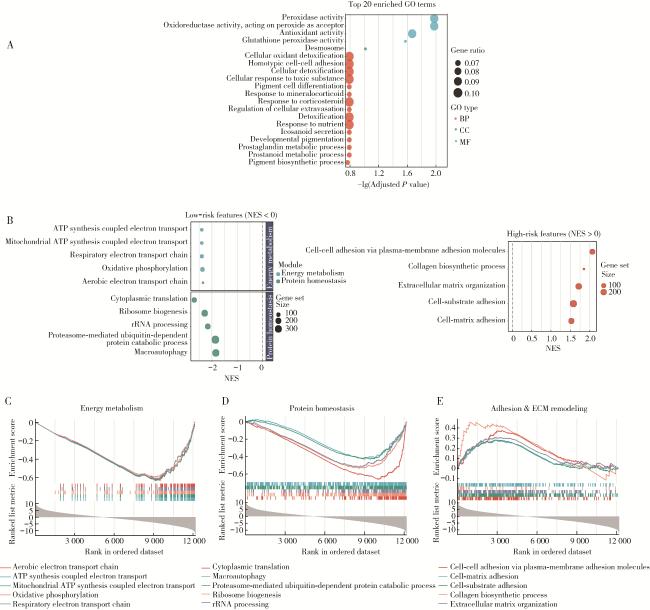
图4 36基因模型相关的生物学通路和机制Figure 4 Biological pathways and mechanisms associated with the 36-gene signature A, GO enrichment analysis of the 36 signature genes (top 20 pathways ranked by adjusted P value shown); B, GSEA bubble plot in high-and low-risk patients; C, GSEA plot of the "Energy metabolism" pathway; D, GSEA plot of the "Protein homeostasis" pathway; E, GSEA plot of the "Adhesion and ECM remodeling" pathway. GO, gene ontology; NES, normalized enrichment score; GSEA, gene set enrichment analysis; ECM, extracellular matrix; BP, biological process; CC, cellular component; MF, molecular function. |